Market abhi ek critical zone par trade kar rahi hai jahan se next major move decide hoga. Recent price action ke mutabiq, Bitcoin (BTC/USDT) strong support area ke qareeb stabilize karta nazar aa raha hai.
🔍 Market Overview
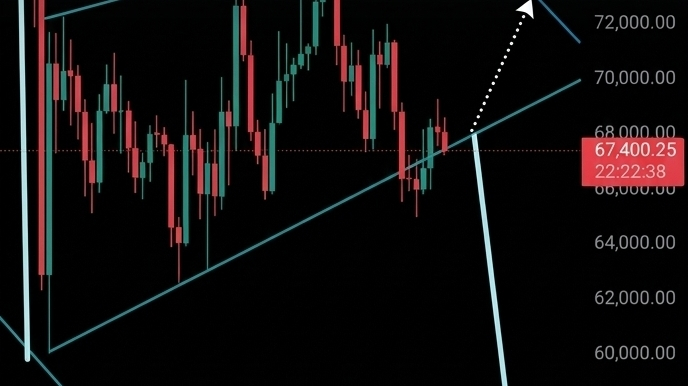
Current price approx $67,400 ke aas paas trade ho rahi hai, jahan buyers ne pehle bhi strong reaction diya hai. Yeh zone historically demand area raha hai, is liye yahan se reversal ke chances barh jate hain.
📈 Technical Analysis
1. RSI Behavior
RSI (14) around 44 par hai jo neutral zone me aata hai. Yeh indicate karta hai ke market oversold se recover ho rahi hai aur ek potential upward momentum build ho sakta hai.
2. Trend Structure
Chart par ek ascending trendline support clearly visible hai. Price multiple times is trendline ko respect kar chuki hai, jo ek bullish continuation ya reversal ka signal ho sakta hai.
3. Bullish Setup Formation
Recent candles suggest kar rahi hain ke selling pressure kam ho raha hai aur buyers gradually control le rahe hain. Agar yeh structure hold karta hai, to upward breakout expected hai.
🎯 Key Levels to Watch
🟢 Support Zone: $66,000
🔵 Immediate Resistance: $72,000
🚀 Major Target: $76,000
⚠️ Scenario Planning
✔️ Bullish Case:
Agar price strong support hold karti hai aur volume ke sath upward breakout milta hai, to next move $72k → $76k ki taraf ja sakta hai.
❌ Bearish Case:
Agar support break hota hai, to downside continuation possible hai, aur market lower levels test kar sakti hai.
🧠 Conclusion
Market ek decisive phase me hai. Is waqt sab se important cheez patience aur confirmation hai. Blind entries lene ke bajaye, breakout ya support confirmation ka wait karna zyada safe approach hai.
📌 Reminder: Always manage risk & do your own research (DYOR)
$ETH
#USJoblessClaimsNearTwo-YearLow
#38k