$ZBT 1-Week Performance & Trade Plan (Weekly Update)
Time window: last 7 days
Trend summary:
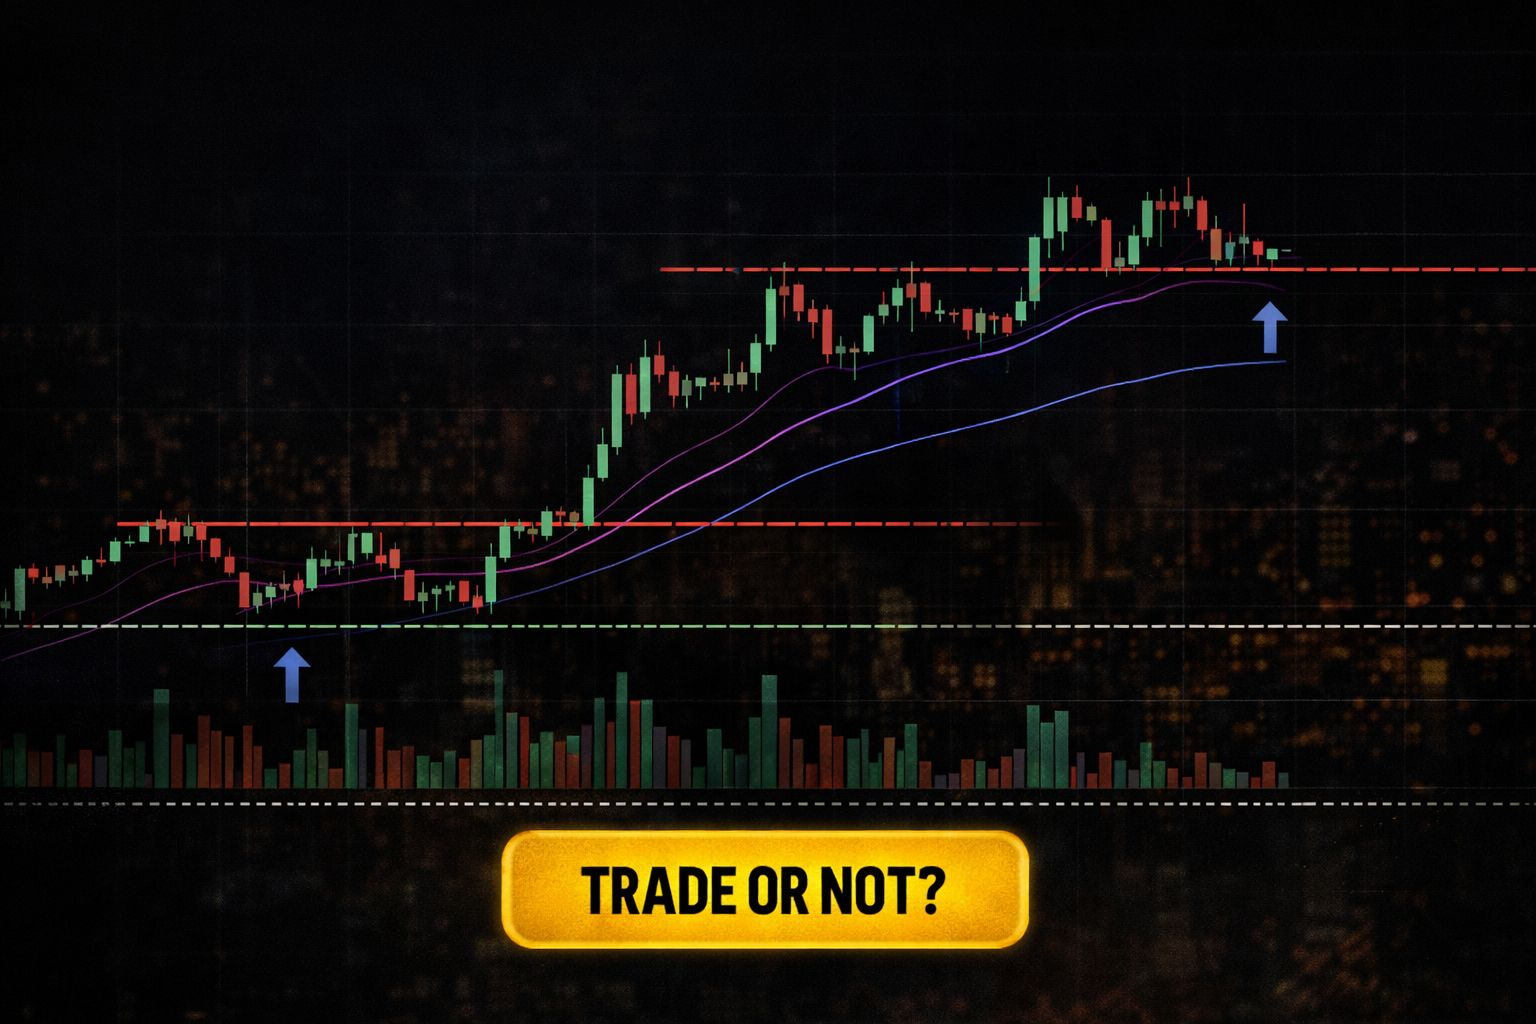
Structure: Identify if price made higher highs/higher lows (uptrend) or lower highs/lower lows (downtrend).
Volatility: Note if candles are expanding (riskier) or contracting (setup forming).
Volume: A healthy move usually shows rising volume on breakouts and lighter volume on pullbacks.
Key levels (must-have):
Support: last clear demand zone / prior swing low
Resistance: prior swing high / rejection zone
Invalidation: level where your idea is clearly wrong (usually below support for longs / above resistance for shorts)
Momentum checklist:
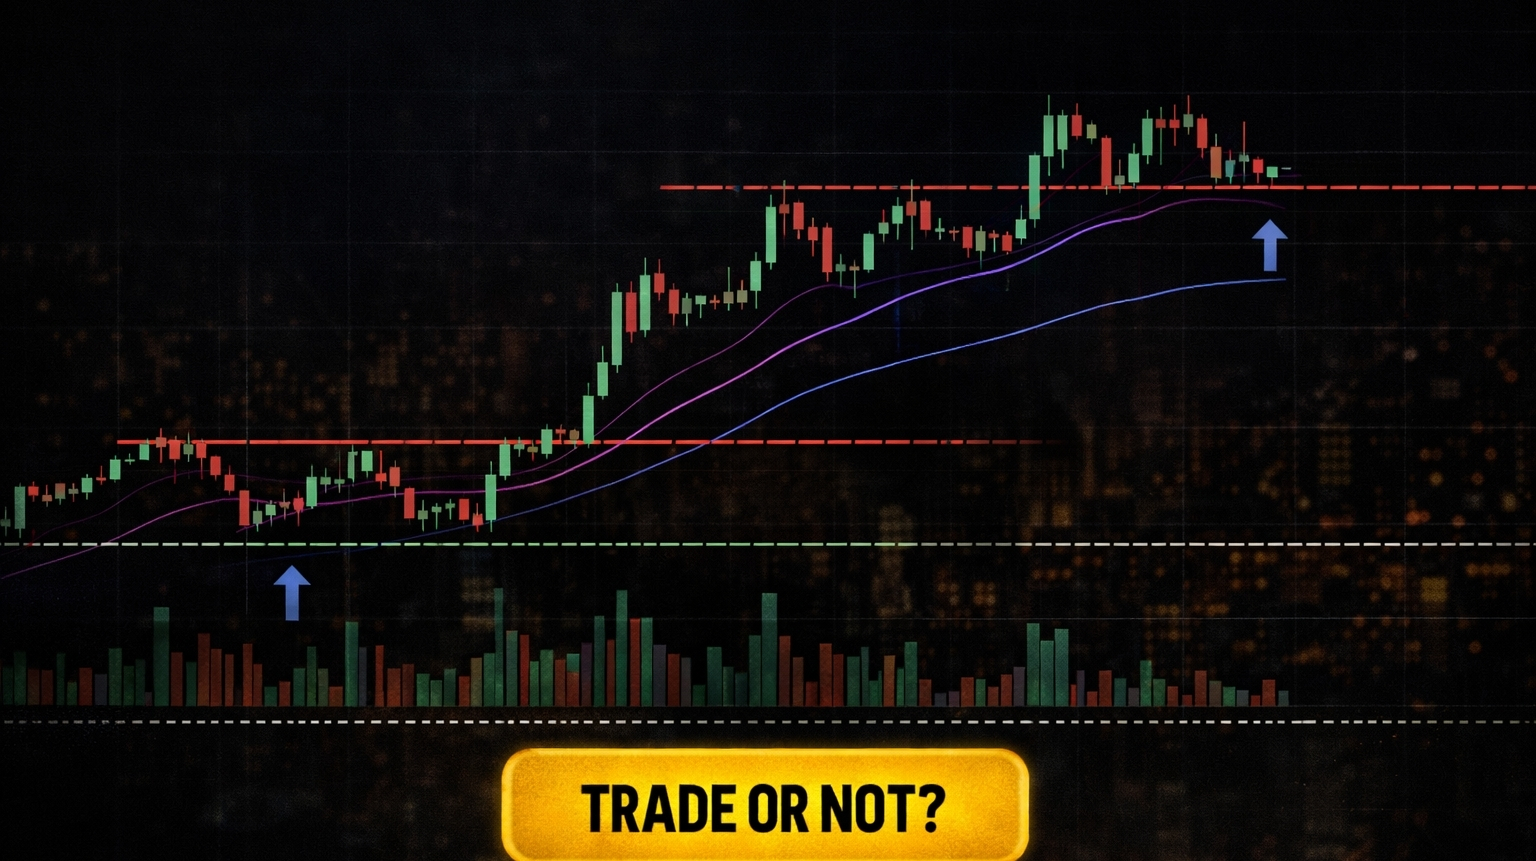
If price is above key moving averages and holding them on pullbacks → bullish bias
If price is below and rejecting them → bearish/avoid or only short-term trades
If price is ranging between support/resistance → trade the edges, not the middle
Trade or Not?
Conservative call (recommended for most):
No trade unless ZBT breaks and closes above resistance with solid volume, or gives a clean bounce at support with clear confirmation.
If trading (example plan):
Entry: only after confirmation (breakout retest or support bounce)
Stop-loss: beyond invalidation level (don’t place “too tight”)
Take-profit: scale at resistance zones; don’t aim for one perfect exit,
Risk: keep it small (e.g., 1–2% account risk per trade)
If your balance is ~4 USDT: you may want to avoid trading until you can size positions meaningfully, because fees/slippage can dominate results.