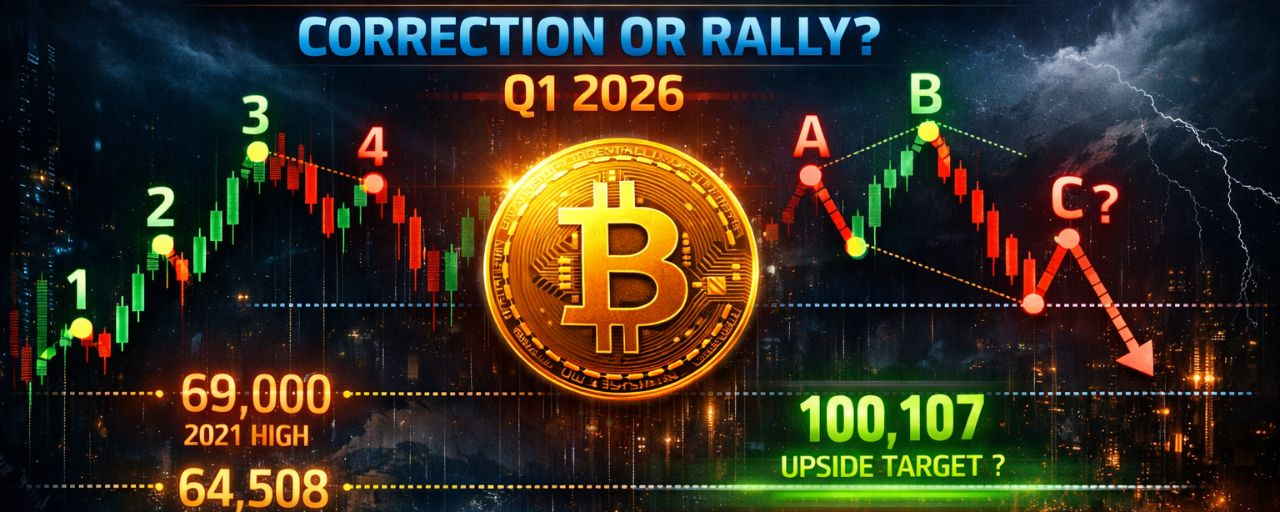
$BTC With Q1 2026 now closed, it is essential to reassess Bitcoin’s structure on higher time frames.
From a macro perspective, the annual chart aligns well with Elliott Wave Theory, showing:
Three completed impulse waves (1–3–5)
Two corrective waves (2–4)
This suggests that the market may have entered a macro corrective phase (A–B–C), with price currently developing Wave A (downward leg).
Current Market Structure
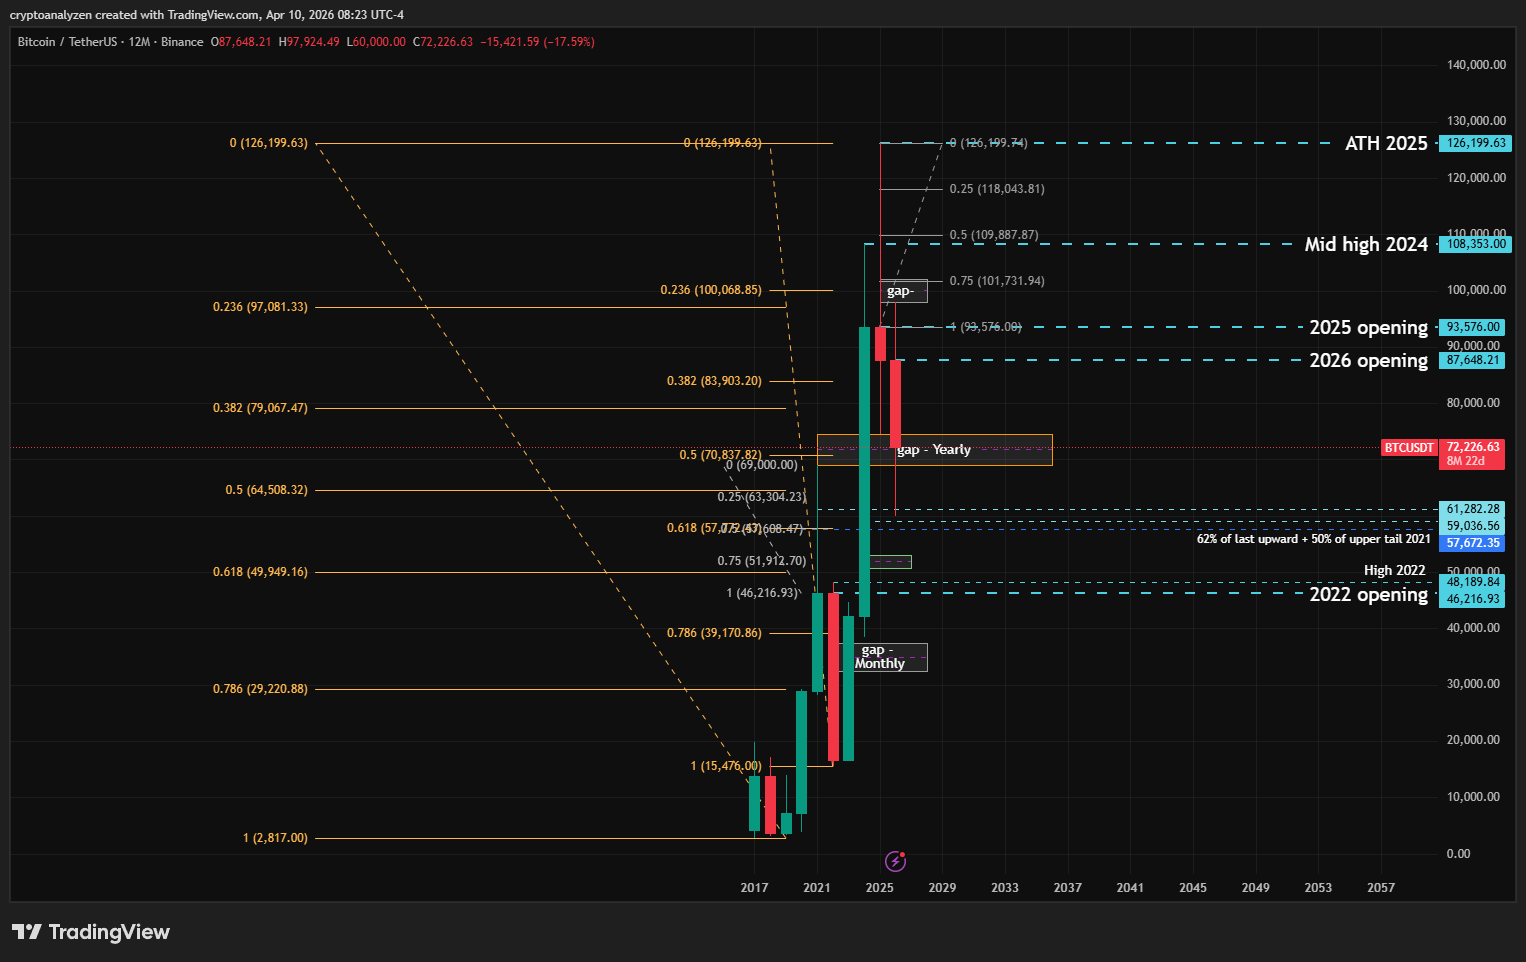
On the annual chart:
The price has successfully filled the gap between the 2021 high (69,000) and the 2025 low (74,508)
The gap midpoint is located at 71,789
The February decline:
Broke below the 50% macro range (64,508.32)
However, it failed to reach 57,672.35, which represents:
50% of the upper wick of the 2021 candle
~62% Fibonacci retracement of the recent impulse move
Key Downside Levels
If the correction continues, the following levels are critical:
69,000 → 2021 high / lower boundary of the annual gap
64,508.32 → 50% of macro range (ATL–ATH)
49,949.16 → 62% retracement of macro range
48,189.84 → 2022 high
46,216.93 → 2022 open
Monthly Projection
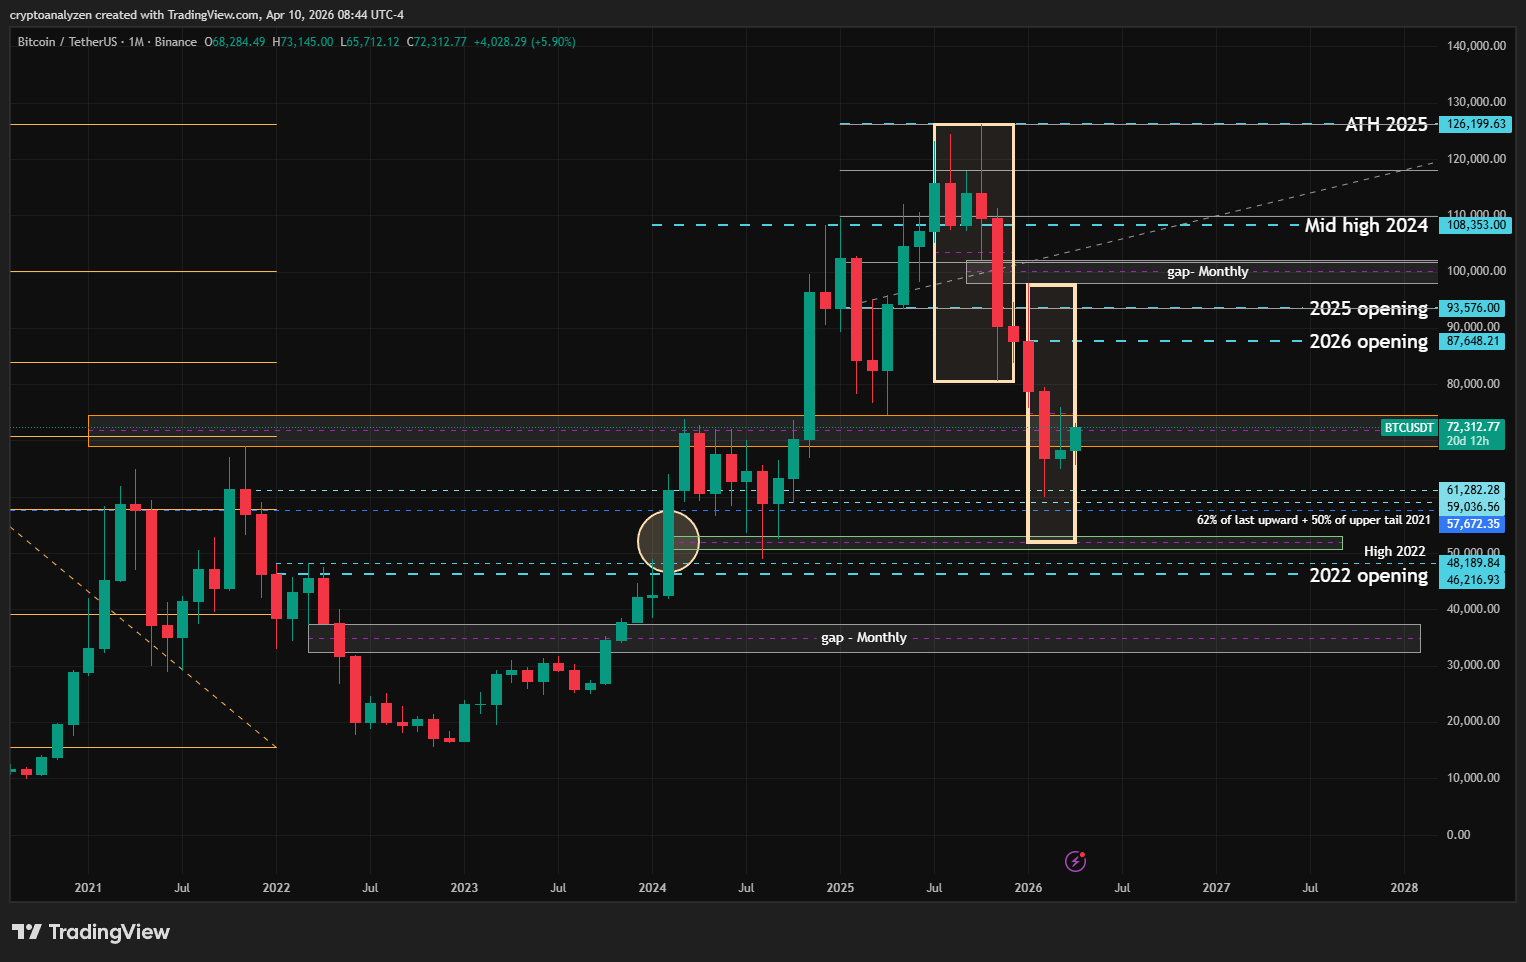
The monthly chart provides a clearer Elliott Wave structure.
Projecting the first downward leg:
Target aligns with a lower time frame gap midpoint at ~51,968
Capitulation Zone (High-Probability Demand Area)
The most critical area for a potential bottom:
37,579 – 32,428
This zone represents:
Likely Wave A completion
Strong institutional demand (“smart money” interest)
A base for projecting Wave B (upward retracement)
Alternative Scenario (Bullish Case)
Given that the decline paused within the 2024 accumulation zone, we cannot exclude the possibility that:
Wave A has already completed
Wave B (upward movement) is beginning
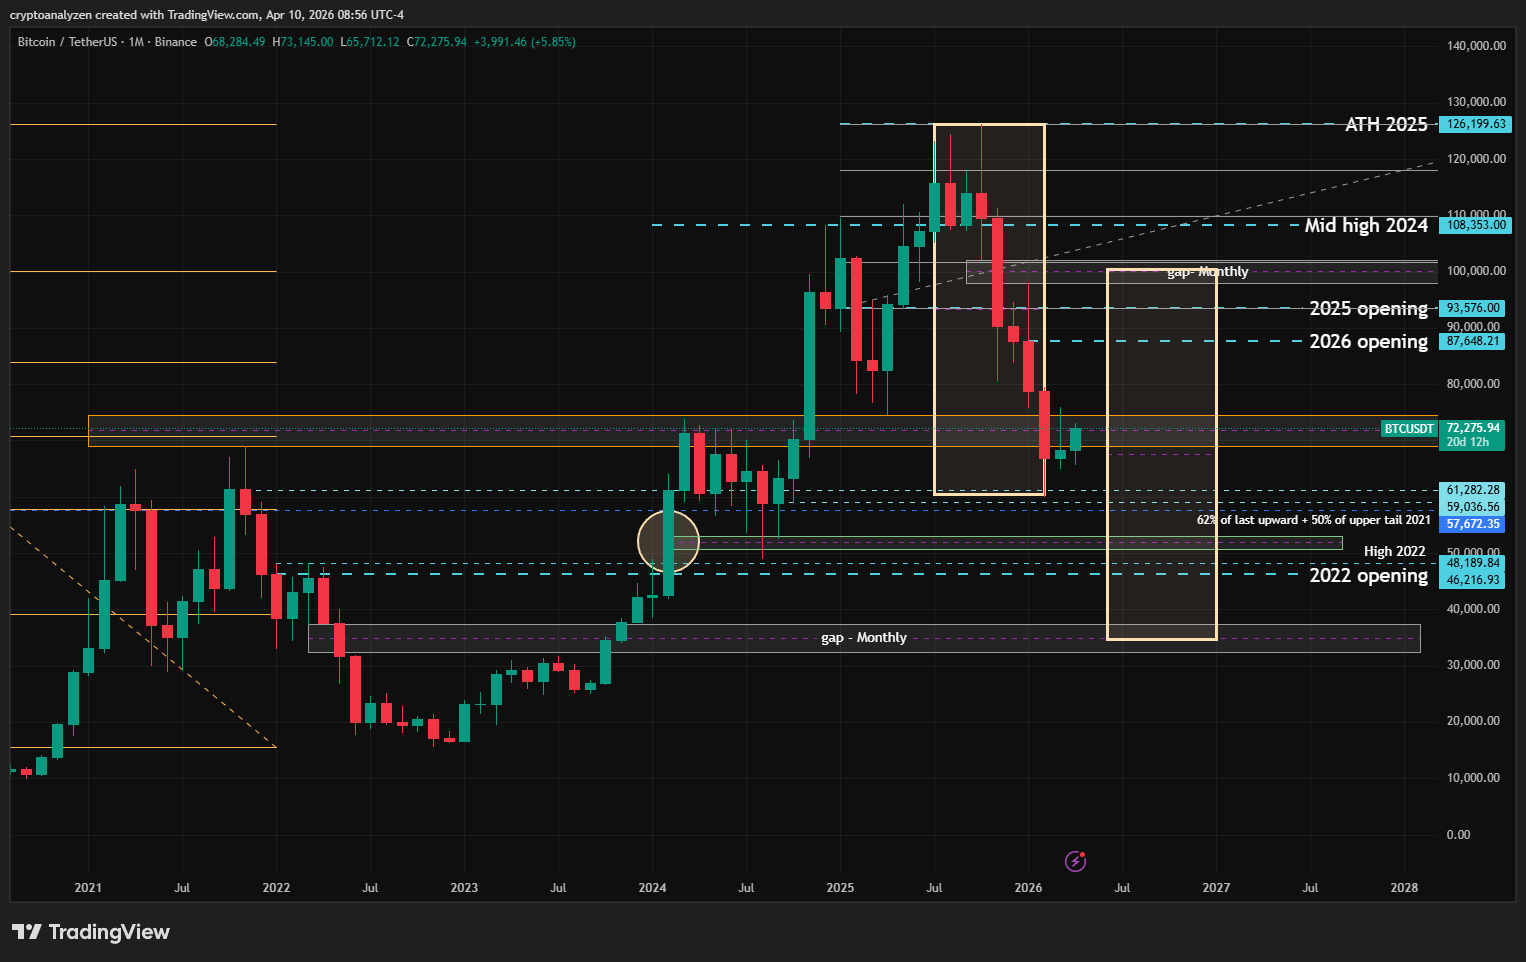
BTC Monthly Upward Projection
Upside Target
Projecting the decline range upward from the capitulation zone:
Target: 100,107
This level represents:
The midpoint of an unfilled upper gap between:
October 2025 low: 102,000
January 2026 high: 97,924
