10 aprilie 2026 · 18:18 UTC
THETRAP A FOST SETAT
+11.75
Închis P&L (USDT)
13.51
Raport Risc/Recompensă
2242
Lichiditate Sustrasă La
derulează
// 01 · CE S-A ÎNTÂMPLAT
Setarea despre care nimeni nu a vorbit
Pe 10 aprilie 2026, piața futures perpetue Ethereum a executat o operațiune de Smart Money conform manualului pe graficul de 5 minute. Prețul a fost împins în jos într-o zonă de cerere cheie în jurul $2,242 — un nivel plin de stop loss-uri pentru retail și intrări scurte — înainte de a se întoarce violent și a urca cu peste 12 puncte.
Aceasta nu a fost o mișcare aleatorie. A fost o captare deliberată și calculată a lichidității — genul care se întâmplă de sute de ori pe zi în piețele cripto și care separă traderii profitabili constant de cei care se întreabă de ce piața "îi oprește întotdeauna înainte de a se mișca."
PATRONUL ACȚIUNII PREȚULUI — SWEEP Apoi RALIU
TEORIA LIQUIDITĂȚII
// 02 · CONCEPTUL
Ce este lichiditatea și de ce este vânată?
În tranzacționare, lichiditatea se referă la grupuri de ordine în așteptare — pierderi de stop, ordine limită și ordine de cumpărare/vânzare care așteaptă — care stau la niveluri de preț previzibile. Acestea nu sunt aleatorii. Ele se acumulează la niveluri tehnice evidente: sub minime recente, deasupra maximelor recente, la numere rotunde și la punctele de swing anterioare.
"Piața nu este o mașină de descoperire a prețurilor. Este un motor de recoltare a lichidității. Merge acolo unde sunt ordinele."
— Cadru de concepte ale banilor inteligenți
Jucătorii instituționali mari — bănci, firme de prop, fonduri de hedging — au nevoie de flux de ordine masiv pentru a-și umple pozițiile fără slippage. Ei nu pot pur și simplu "cumpăra la piață" fără a mișca prețul împotriva lor. Așa că, în schimb, își inginerizează mișcările de preț pentru a ajunge la piscinele de lichiditate, a-și umple pozițiile și apoi a inversa direcția.
🎯
Lichiditate pe partea de vânzare
Pierderile de stop ale traderilor lungi care stau SUB minime recente. Banii inteligenți împing prețul în jos pentru a le captura.
⚡
Lichiditate pe partea de cumpărare
Pierderile de stop ale traderilor scurți care stau DEASUPRA maximelor recente. Banii inteligenți împing prețul în sus pentru a le captura.
🔄
Inversarea
Odată ce lichiditatea este capturată și instituțiile sunt umplute, prețul se inversează brusc — mișcarea "reală" începe.
// 03 · ANATOMIA
Cum s-a desfășurat mișcarea ETH
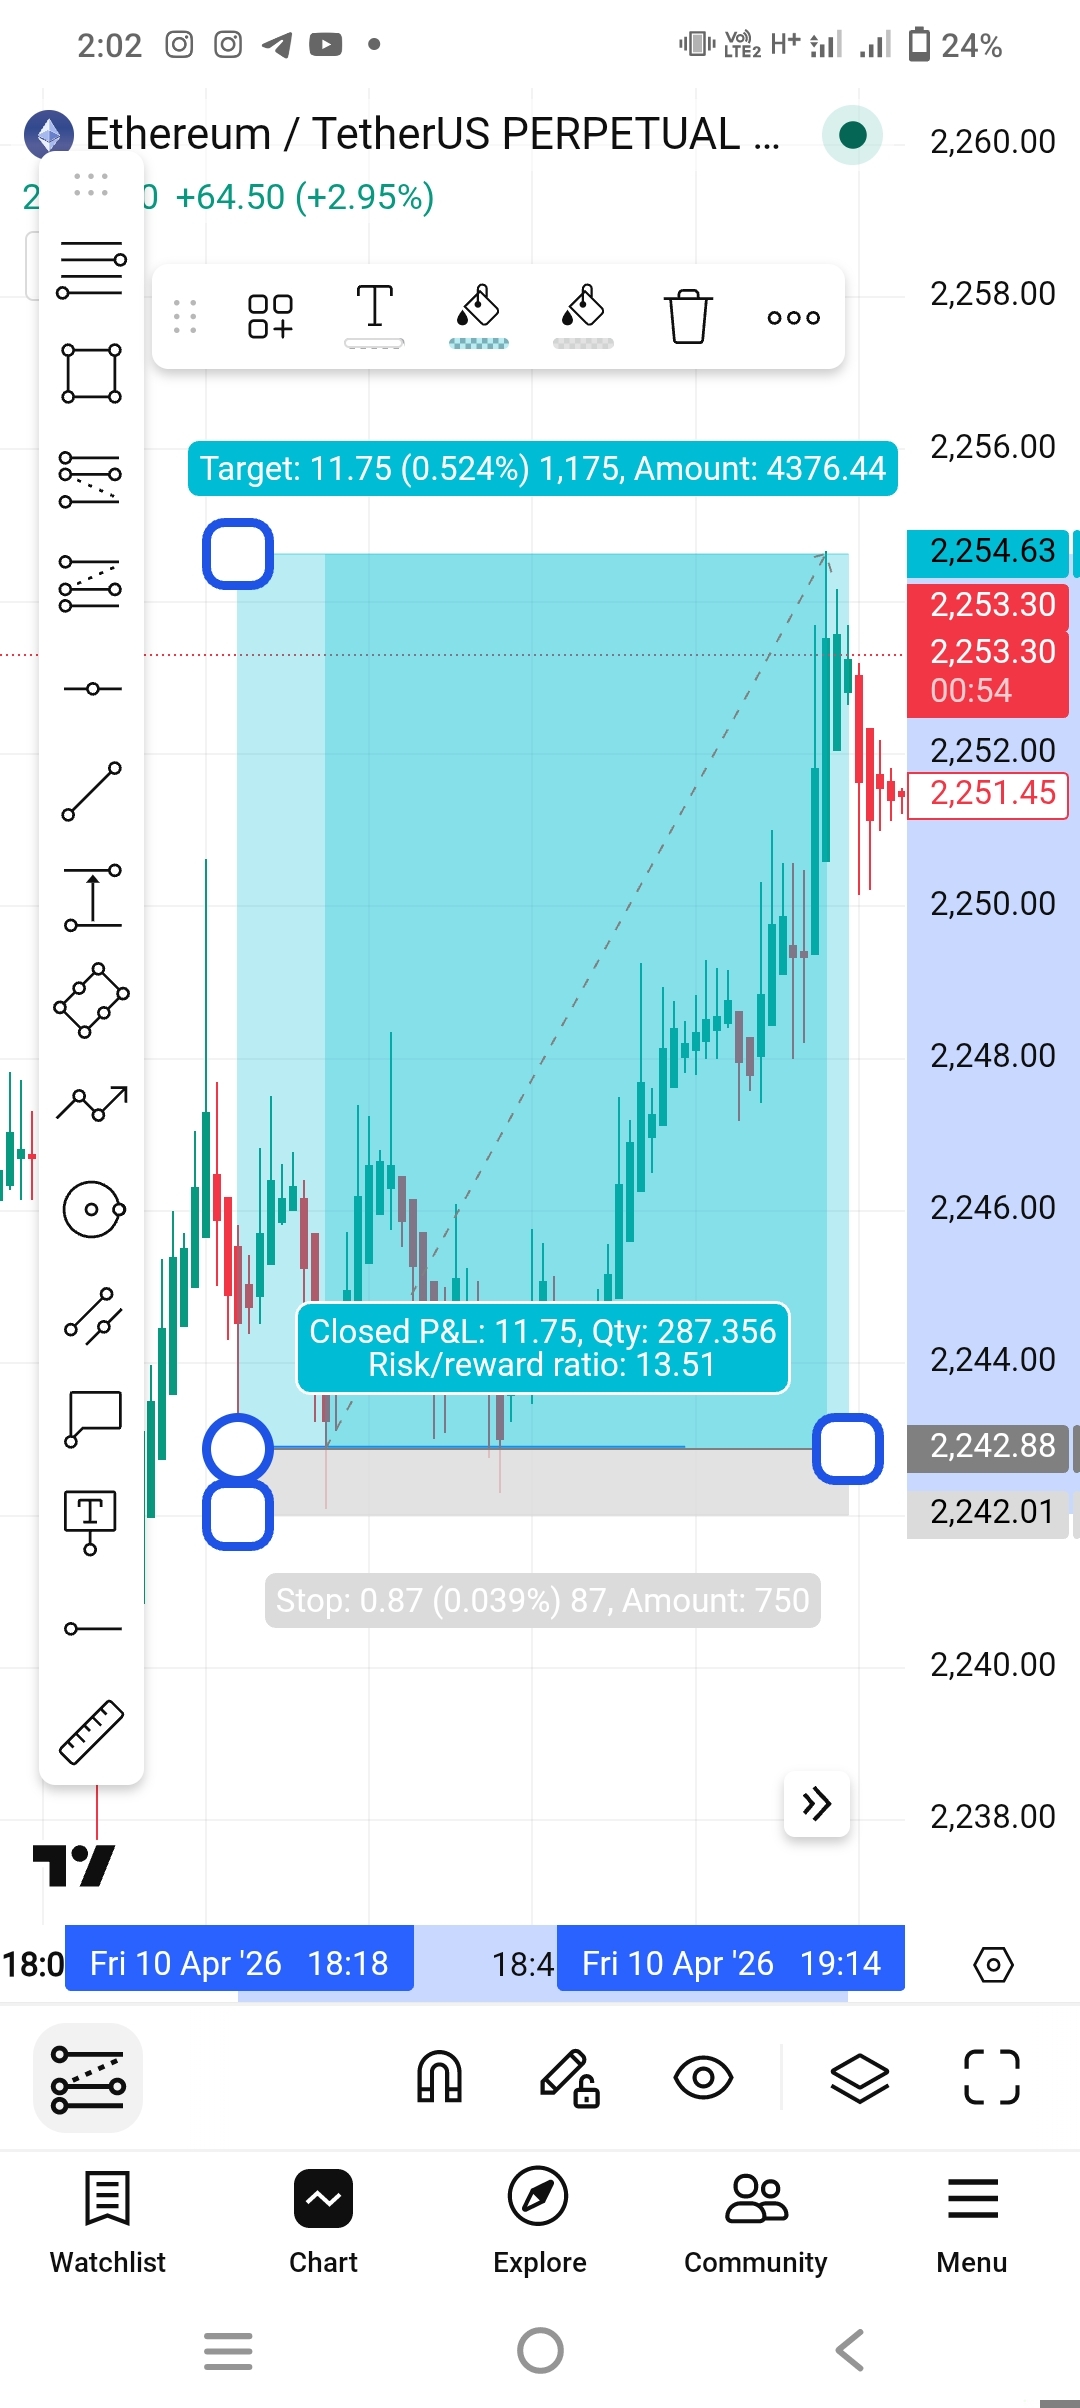
Iată secvența exactă de evenimente care s-a desfășurat pe 10 aprilie 2026, între 18:00–19:14 UTC pe graficul perpetuu de 5 minute ETH/USDT:
// SECVENȚA EVENIMENTELOR
01
Consolidarea formează un interval
Prețul ETH se consolidează între ~$2,243 și ~$2,254. Traderii de retail văd un "suport" la $2,242-43 și plasează intrări lungi acolo cu ordine de stop în jos. Vânzătorii scurți intră de asemenea la vârful intervalului.
VARIAT
02
Prețul scade sub suport
Banii inteligenți inginerizează o împingere sub $2,242.88 — exact nivelul vizibil pe grafic. Toate ordinele de stop ale traderilor de retail se declanșează. Vânzătorii scurți se simt confirmați. Aceasta creează lichiditatea necesară pentru ca instituțiile să absoarbă vânzarea și să construiască poziții lungi.
SWEEP
03
Semnal de absorbție și inversare
Prețul nu reușește să continue mai jos. Presiunea de vânzare se usucă deoarece banii inteligenți absorb fiecare ordin de vânzare. O lumânare bullish se formează deasupra nivelului trecut — lumânarea de deplasare.
INVERSARE
04
Raliu impulsiv puternic
Prețul scade de la ~2,243 la ~2,254-55 în câteva minute. Vânzătorii care au intrat la vârf sunt acum prinși, iar pierderile lor de stop alimentează mișcarea ascendentă — o cascadă de ordine de cumpărare.
RALIU
// 04 · NUMERELE
Tranzacția care a capturat-o
Un trader care a identificat acest sweep de lichiditate și a intrat lung la nivelul capturat a obținut o tranzacție aproape perfectă. Iată numerele exacte din captura de ecran:
+11.75
P&L (USDT)
13.51
Riscul/Recompensa
287.4
Cantitate (ETH)
0.87
Riscul (Stop)
Un risc de 0.87 USDT pentru o recompensă de 11.75 USDT. Acesta este ceea ce se întâmplă când tranzacționezi CU fluxul de lichiditate și nu împotriva lui. Stopul a fost plasat chirurgical dedesubtul sweep-ului — suficient de departe pentru a evita ieșirile premature, suficient de aproape pentru a menține riscul minim.
CUM SĂ O TRANZACȚIONEZI
// 05 · CADRUL
Cum să identifici și să tranzacționezi capturile de lichiditate
Regulile
Identifică
niveluri evidente de suport și rezistență
pe intervalul tău de timp. Acestea sunt locurile unde lichiditatea se acumulează. Dacă este evident pentru tine, este evident pentru toată lumea — ceea ce înseamnă că ordinele de stop stau acolo.
Fii atent la o
vârf sub suport sau deasupra rezistenței
care se inversează rapid. Aceasta este sweep-ul. O lumânare care sfâșie agresiv printr-un nivel și se închide înapoi deasupra/sub este un semnal puternic.
Așteaptă un
lumânare de deplasare
— o lumânare puternică, de corp întreg care se îndepărtează de nivelul trecut în direcția opusă. Aceasta confirmă că absorbția banilor inteligenți este completă.
Intră pe
retestare sau imediat după confirmare
. Plasează-ți stopul imediat dincolo de wick-ul sweep-ului — nu la nivelul în sine, ci dincolo de capturarea lichidității.
Țintește următoarea piscină de lichiditate
— înaltul/scăzutul anterior, înălțimi egale sau o zonă de rezistență evidentă. Banii inteligenți vor împinge prețul către următoarea zonă de ordine concentrate.
Folosește
confluență
: deschiderea sesiunii, nivelurile cheie pe un interval de timp mai mare, blocurile de ordine și lacunele de valoare corectă cresc toate probabilitatea ca tranzacția să se desfășoare.
"Nu mai gândi ca un trader de retail care are nevoie de confirmare. Confirmarea ESTE sweep-ul. Până când graficul pare sigur, mișcarea este deja terminată."
— ICT / Conceptul Banilor Inteligenți
// 06 · PSIHOLGIA
De ce aceasta continuă să funcționeze
Capturile de lichiditate funcționează deoarece psihologia umană este previzibilă. Traderii de retail au fost învățați să plaseze ordinele de stop sub suport și să cumpere la reveniri. Fac asta în fiecare zi, în fiecare piață, creând exact piscinele de lichiditate de care au nevoie instituțiile.
Aceasta nu este o conspirație. Aceasta este mecanica pieței. Ordinele instituționale sunt pur și simplu prea mari pentru a fi umplute fără a ingineriza mișcarea prețului. Înțelegerea acestui lucru îți transformă modul în care vezi fiecare grafic — în loc să vezi "wick-uri aleatorii", vezi inginerie calculată.
🧠
Psihologia de retail
"Suportul a ținut ultima dată, voi cumpăra aici și voi pune stopul meu dedesubt." — repetat de milioane de traderi, creând exact capcana.
🏦
Nevoia instituțională
Un fond care cumpără 10,000 ETH are nevoie de vânzători. Cine sunt vânzătorii? Traderi de retail panicați ale căror ordine de stop tocmai au fost declanșate.
📈
Avantajul
Odată ce înțelegi această dinamică, încetezi să mai fii lichiditate și începi să vânezi alături de vânători.
// 07 · CONCLUZIA
Gânduri finale
Mișcarea ETH de pe 10 aprilie 2026 nu a fost noroc. Nu a fost zgomot. A fost un model calculat, reproducibil care se desfășoară zilnic în piețele crypto, forex și de acțiuni. Sweep-ul de $2,242, inversarea, riscul/recompensa de 13.51 — toate acestea au fost citibile în timp real pentru un trader care a înțeles unde locuia lichiditatea.
Piața nu îți datorează o intrare clară sau o călătorie fără durere. Dar dacă înțelegi cine mișcă efectiv prețurile și de ce, poți începe să te poziționezi de partea corectă a ecuației — nu ca prada, ci ca prădătorul care a anticipat vânătoarea.
Cei mai buni traderi nu prezic piața. Ei înțeleg suficient de bine mecanicile acesteia încât atunci când capcana este întinsă, ei sunt cei care țin plasa — nu prinși în ea.


