Introduction.
Most traders wait for the green candle to pump before entering. By then, it’s already too late. If you want to stop being "liquidity" for big players, you need to understand the footprints they leave behind. After 7 years in the markets, I’ve realized that the most profitable trades aren't found in the news—they are found in the hidden convergence of data.
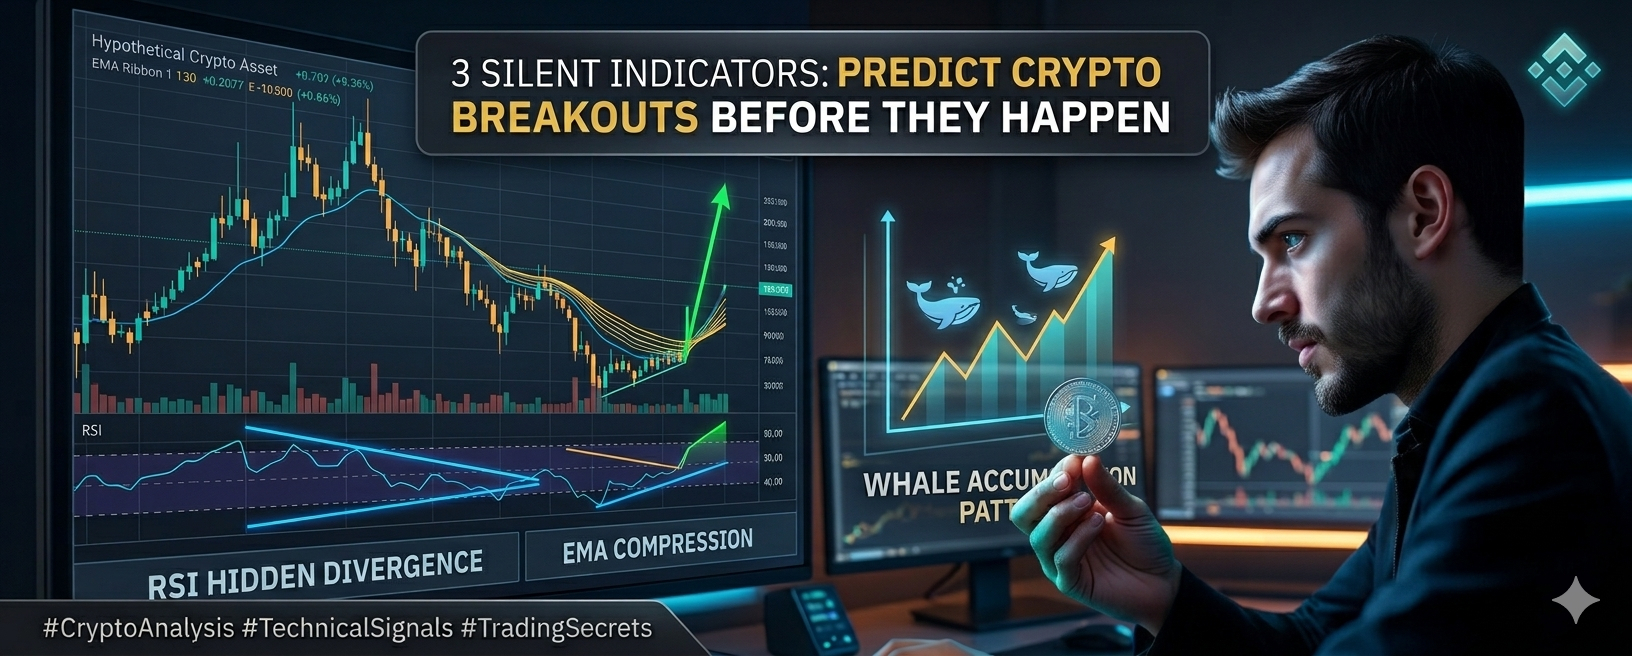
1. The "RSI Hidden Divergence" Trap
Everyone knows that RSI above 70 is overbought. But professional traders look for Hidden Bullish Divergence.
The Secret: When the price makes a higher low, but the RSI makes a lower low, it indicates that the trend is gathering massive hidden strength.
Tip: Watch this on the 4H timeframe for coins like SUI or NEAR before a major leg up.
2. EMA Ribbon Compression
Think of the Exponential Moving Averages (EMA) as a spring. When the 20, 50, and 200 EMAs are tangled together and moving sideways, the "spring" is being compressed.
The Move: The longer the sideways squeeze, the more violent the breakout.
Action: When you see the EMA ribbons starting to fan out (expand) after a long squeeze, that is your signal to enter.
3. The "Risk-Off" Geopolitical Filter
Technical analysis is only 50% of the game. The other 50% is global sentiment. During times of international tension, the market moves into a "Risk-Off" mode.
When volatility spikes globally, BTC often reacts first. Always check the DXY (Dollar Index) before opening a high-leverage long position. If the Dollar is pumping, wait for the dust to settle.
My "Golden Rule" for 2026:
Stop chasing pumps. Start hunting for volume clusters. If a coin is consolidating on low volume but the MACD is slowly curving upward, the "Whales" are accumulating.
What are you holding this week? I’m currently watching the AI sector and some specific L1 protocols very closely.$RAVE $SIREN $MOVR
👇 Drop your favorite coin in the comments and I will analyze the chart for you!