Cryptocurrency markets are currently at a critical crossroads, and all eyes are on Solana ($SOL). As we navigate through the volatility of April 2026, understanding chart structures has never been more vital for consistent profitability.
The Technical Breakdown
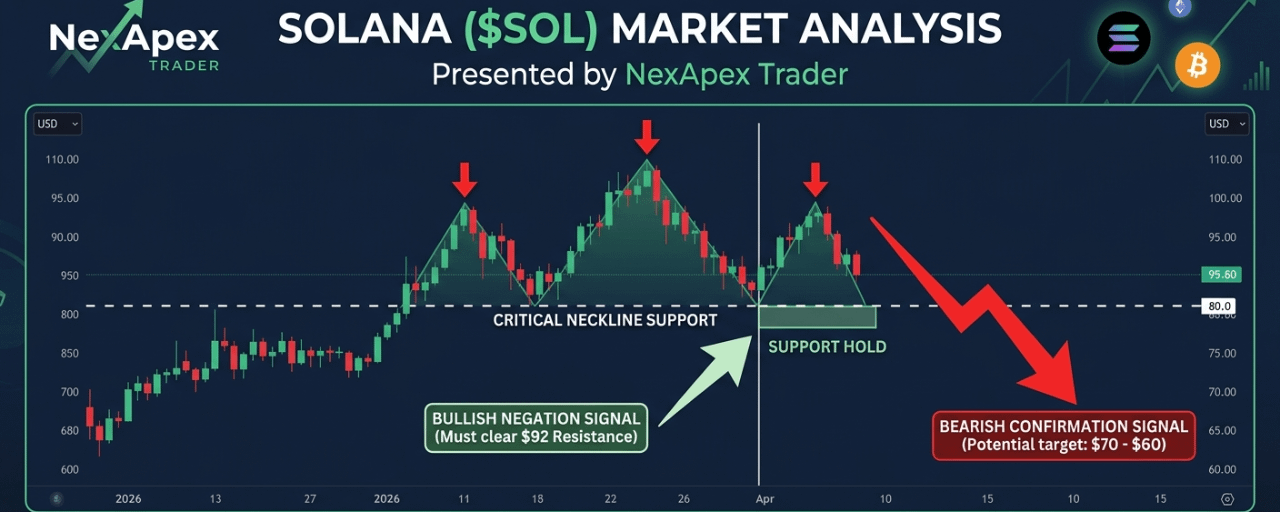
Recent price action has formed a classic Head and Shoulders pattern—a signal that often keeps seasoned traders on high alert. This pattern typically suggests a potential trend reversal from bullish to bearish, but in crypto, the "fake-out" is always a possibility.
The Bearish Threat: A decisive close below the $80 neckline could trigger a slide toward the $60-$70 support zone. Volume analysis shows increased pressure on downward moves, suggesting caution for long-term holders.
The Bullish Negation: To invalidate this bearish structure, $SOL must reclaim and hold above the $92 resistance. A breakout here would catch shorts off-guard, potentially fueling a "short squeeze" toward $110+.
Strategy for Traders
In a market this undecided, patience is your greatest asset. Successful trading isn't about guessing the direction; it's about reacting to confirmed breakouts with strict risk management.
Watch the Volume: True breakouts are accompanied by a spike in trading volume.
Confirm the Close: Don't jump in on a wick; wait for a candle body to close outside the key levels.
Risk Management: Always set your stop-loss just above the previous "shoulder" to protect your capital.
The market doesn't pay for being right; it pays for being disciplined. Stay sharp, watch the levels, and trade the plan!
#CryptoTrading #Solana #TechnicalAnalysis #TradingStrateg #NexApexTrader What’s your move? Will $SOL break below $80 or recover back to $92? Let me know your thoughts in the comments!"