
Bitcoin (BTCUSD) a întrerupt seria sa de 6 luni de scădere în martie și acum construiește un raliu impresionant în această lună, alături de acțiuni. Cu toate acestea, aceasta se încadrează încă în comportamentul tipic al pieței de urși. Chiar dacă aprilie se închide pe verde, nu ar fi prima dată când BTC a avut două luni consecutive verzi în timpul unui ciclu de urși – am văzut asta înainte: mai-iunie 2014 și februarie-martie 2022.
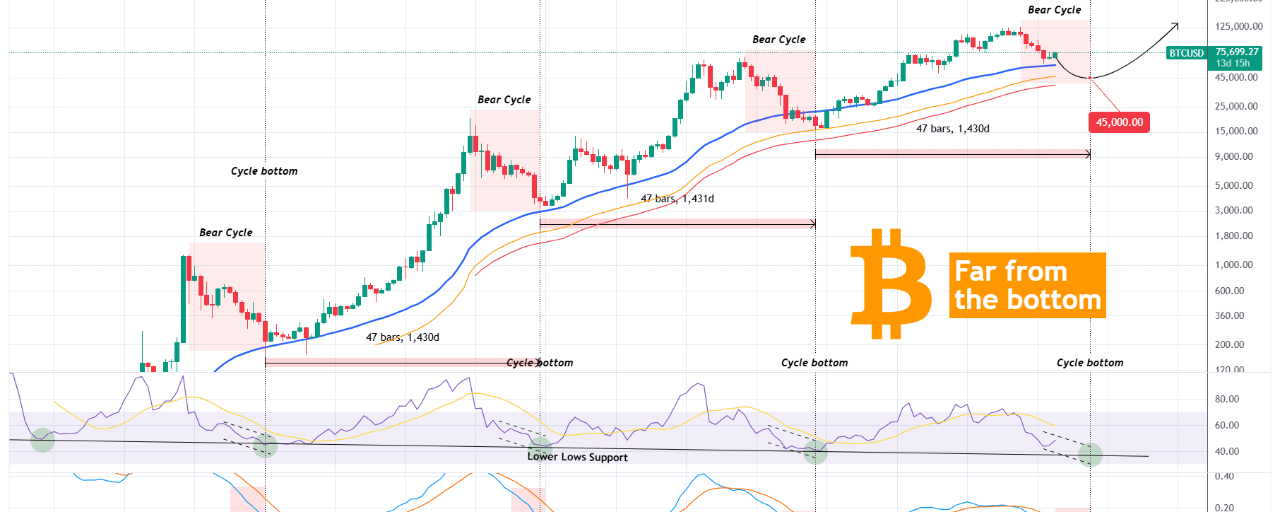
Așadar, rămânem în limitele standardului ciclului de urși. RSI de 1 lună și LMACD de 1 lună confirmă acest lucru – istoric vorbind, acestea sunt cele mai fiabile indicatoare pentru ciclurile Bitcoin. Așa cum arată graficul, BTC a atins minimul de fiecare dată când RSI de 1 lună a atins linia de suport a trendului descendent de 15 ani (cercuri verzi). Raliul actual are loc bine deasupra acelui nivel, ceea ce înseamnă că ciclul de urși nu a atins încă minimul.

Între timp, LMACD de 1M rămâne ridicat fără niciun semn de crossover bullish în vedere. Bara histogramă din aprilie a devenit roșie deschisă – dar chiar dacă aceasta se menține până la sfârșitul lunii, nu ar fi prima dată când o bară roșie deschisă apare înainte de fundul ciclului (s-a întâmplat și în octombrie 2022).

În plus, de la fundul din ianuarie 2015, fiecare minim de ciclu bearish a avut loc la 1.430 de zile (aproximativ 47 de luni) după precedentul. Dacă acest model se repetă, următorul minim nu va apărea înainte de octombrie 2026. Pe deasupra, prețul plutește în prezent ușor deasupra MA50 de 1M (linia albastră), care a fost spartă în timpul ultimului ciclu bearish – cu BTC ajungând în cele din urmă la minim pe MA350 de 1W (linia portocalie). Tehnic, de data aceasta ar putea cădea până la MA100 de 1M (linia roșie). Luate împreună, acestea sugerează o zonă de minim (cumpărare) între $50,000 și $40,000.

Te rog să ÎȚI PLACĂ 👍, SUIȚI ✅, ÎMPĂRTĂȘIȚI 🙌 și FACEȚI COMENTARII ✍ dacă găsești această analiză utilă!
#BTC #BitcoinPriceTrends #bitcoin

