
MAGICUSDT Price Analysis: Approaching a Critical Turning Point
The MAGICUSDT trading pair has been in a clear downtrend over the past several months. By analyzing the chart, we can gain insight into market sentiment and identify potential future price movements.
📉 Trend Overview: Strong Bearish Control
Since around September, the price structure shows:
Lower highs → Each upward move fails to exceed the previous peak
Lower lows → Each decline pushes price further down
This pattern confirms a bearish market structure, where sellers remain in control and overall confidence appears weak.
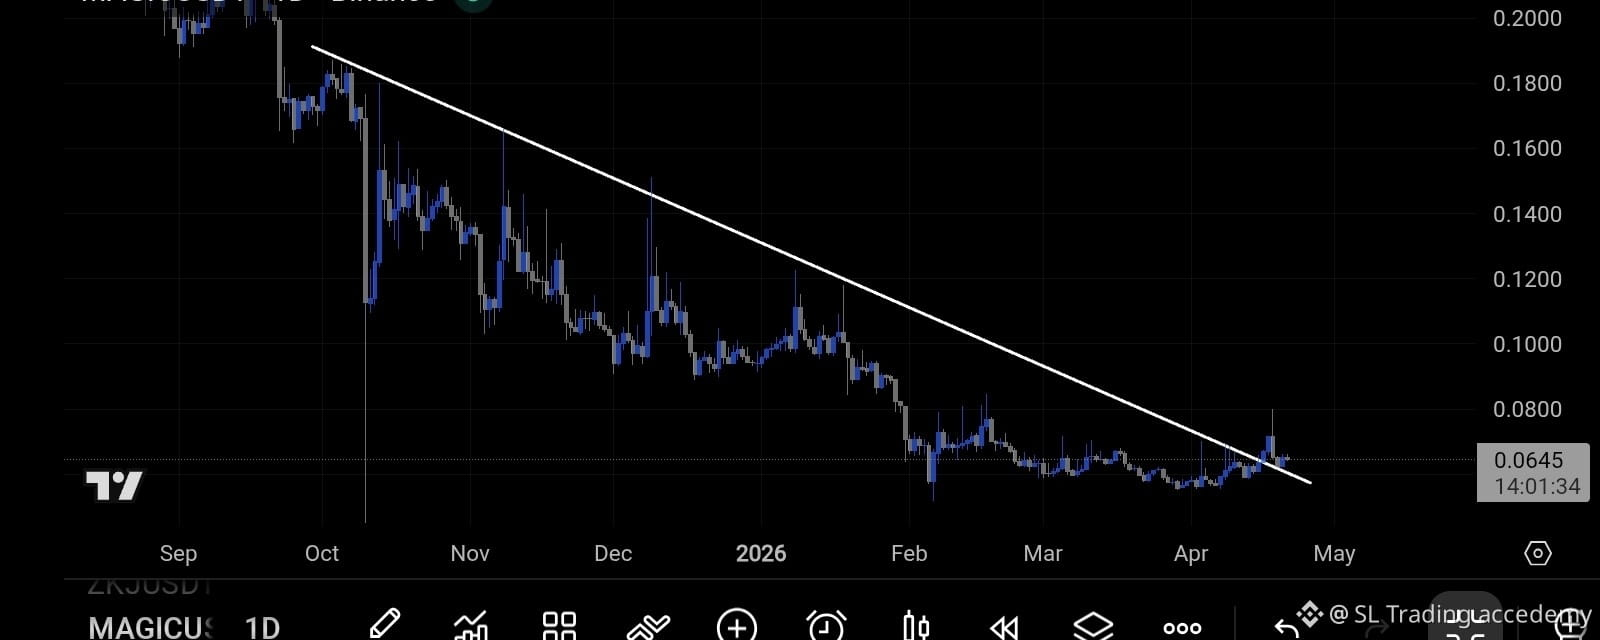
📊 Importance of the Trendline
The descending trendline drawn on the chart acts as a key resistance level.
Price has tested this line multiple times
Each time, it has been rejected and moved lower
This indicates that traders are consistently using this area as a sell zone, reinforcing the downward trend.
🔄 Recent Behavior: Sideways Consolidation
Moving into early 2026, the market shows signs of slowing down:
Price is moving within a tight range
Volatility has decreased
This type of behavior often suggests consolidation, where the market is preparing for its next significant move.
🚦 Possible Future Scenarios
1. Bullish Breakout
If price breaks above the trendline and closes above it on the daily timeframe:
It could signal the end of the downtrend
Buyers may begin to take control
Potential upside targets: around 0.08 – 0.10
2. Bearish Continuation
If price reaches the trendline and gets rejected again:
Sellers remain dominant
The downtrend is likely to continue
New lows could be formed
3. Accumulation Phase
The current sideways movement may represent:
A phase where larger players are accumulating positions
However, this is only confirmed after a clear breakout
👀 Key Signals to Watch
A strong daily close above the trendline
Increased volume during breakout
Formation of higher lows afterward
These signals together would strengthen the case for a bullish reversal.
🔚 Conclusion
MAGICUSDT is currently at a decision point. While the long-term trend remains bearish, the tightening price action suggests that a major move may be approaching.
👉 The direction of that move—up or down—will largely depend on how price reacts to the descending trendline.