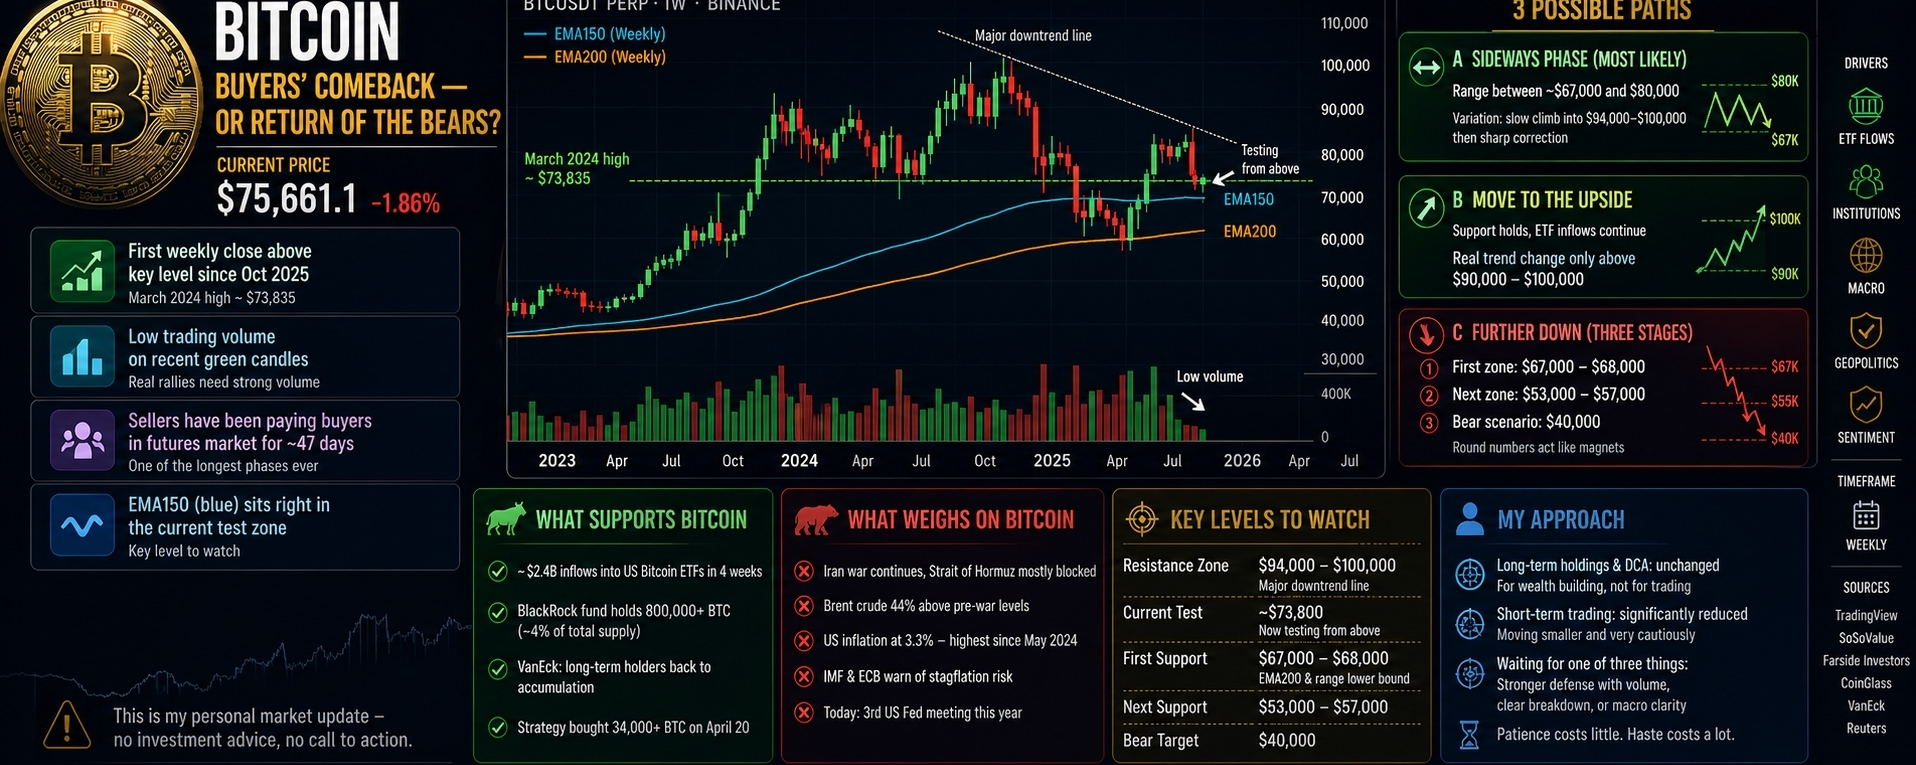
The latest weekly Bitcoin view shows a market stuck between cautious optimism and a fragile setup. Price has managed to move back above an important former support area near $73,800, a level that Bitcoin lost earlier in the year. Now the market is pulling back to retest that zone from above, and this is where the next direction may become visible.
There are still several reasons to be careful. The recent green weekly candles came with unusually weak volume, which makes the move look less convincing. In the futures market, sellers have been paying buyers for an extended stretch, suggesting that part of the rise may be driven by short covering rather than fresh spot demand. On top of that, the medium-term weekly average sits right in the current test area, so this zone is acting as a major technical decision point. If it holds, Bitcoin could have room to continue higher. If it fails, the market may drift sideways again or weaken further.
At the same time, Bitcoin still has meaningful support from the institutional side. U.S. Bitcoin funds have seen strong inflows over the past month, far more than miners have been producing. BlackRock’s fund now holds well over 800,000 Bitcoin, which is a significant share of total supply. Data from VanEck also suggests that long-term holders have started accumulating again after a long period of distribution. Strategy has continued buying aggressively as well, adding tens of thousands of Bitcoin recently.
Still, the broader environment is not helping. Geopolitical tension remains high, oil prices are elevated, inflation is still sticky, and major institutions are warning about the risk of stagflation. In that kind of setting, Bitcoin still behaves more like a risky asset than a classic hedge. The idea that Bitcoin always protects against inflation looks too simple to me. In past crises, it often fell with stocks instead of acting like gold. That said, this cycle has been a bit different, with ETF flows and institutional buying making Bitcoin more resilient than before.
For now, the most likely scenario looks like a sideways range. Bitcoin may continue moving between roughly $67,000 and $80,000 until a clear catalyst appears. A stronger bullish case would require a much more convincing break above the $90,000 to $100,000 area, where the larger downtrend would start to come into question. On the bearish side, the first important support zone sits around $67,000 to $68,000. If that fails, the next area would be around $53,000 to $57,000, and in a deeper bear-market scenario, $40,000 could become a magnet because round numbers tend to attract a lot of buying interest.
My own approach is unchanged. Long-term Bitcoin holdings and DCA remain in place, but short-term trading is reduced and handled very cautiously. Right now the chart does not offer a clean entry signal, and the macro backdrop is still too uncertain for aggressive positioning. I am waiting for one of three things: a stronger defense of the current zone with better volume, a clear breakdown, or a clearer macro picture.
