I’m usually careful about getting overly bullish from a single chart pattern, but the current $SOL structure is becoming increasingly difficult to dismiss from a technical perspective.
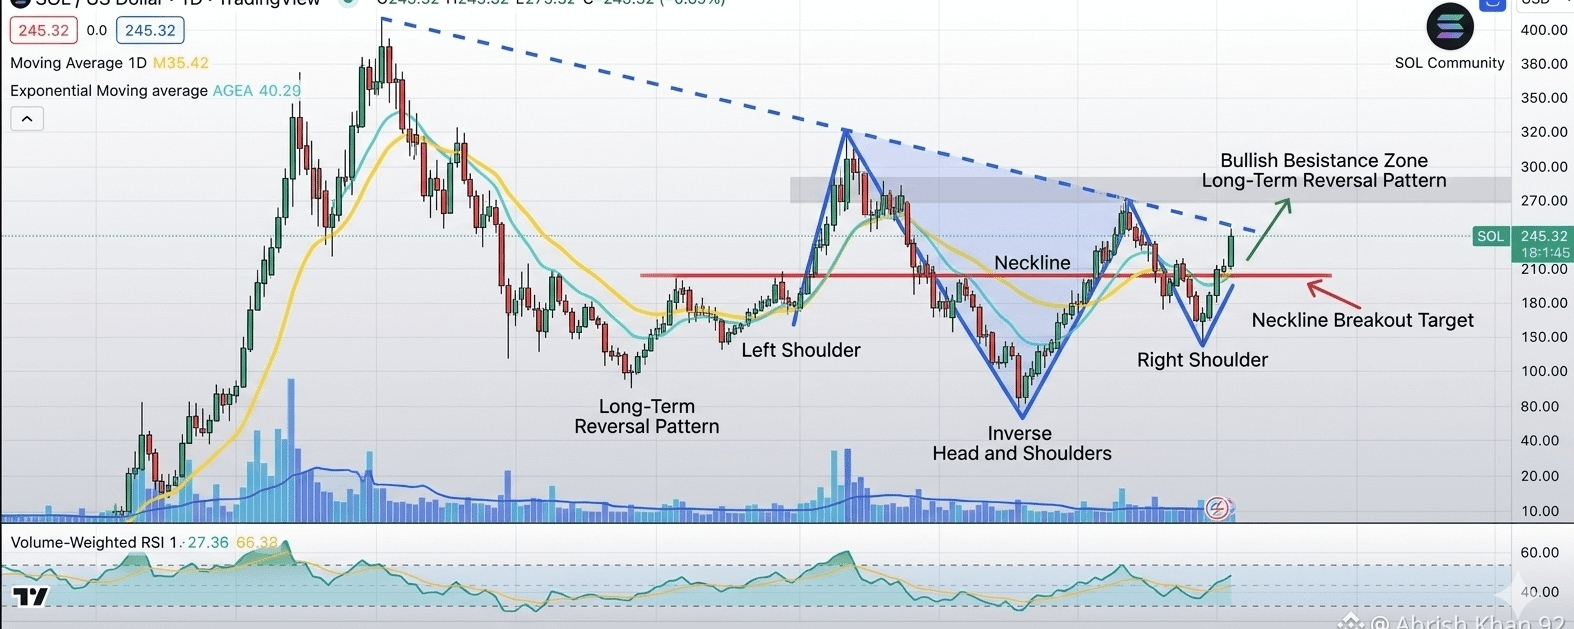
On the higher timeframe, Solana appears to be forming a massive inverse head and shoulders pattern, one of the most recognized long-term reversal structures in technical analysis. What makes this setup especially interesting is not just the pattern itself, but the amount of time it has taken to develop.
This isn’t a short-term breakout forming over a few weeks.
The market has spent a very long period compressing, rotating, correcting, and rebuilding structure after the previous cycle peak. Historically, when large-cap assets spend months building a base like this, the eventual expansion phase can become extremely aggressive once momentum and liquidity return.
Right now, the key area remains the neckline zone around the breakout level highlighted on the chart.
That level is acting as the market’s decision point.
Bulls are slowly attempting to reclaim control after forming what looks like: • Left shoulder • Deep capitulation low forming the head • Higher low structure creating the right shoulder
This gradual transition from lower lows into higher lows is often how major trend reversals begin on macro timeframes.
Another important detail is that price has started reclaiming moving averages while volume structure has stabilized compared to the heavy distribution phase seen after the all-time high. Momentum indicators are also beginning to recover instead of continuously making weaker readings.
Still, confirmation matters.
A clean breakout and sustained hold above the neckline would likely be the real trigger many traders are waiting for before positioning more aggressively. Without confirmation, the setup remains a developing pattern rather than a completed reversal.
If buyers successfully defend this region and push through resistance, the next focus would likely shift toward the larger descending resistance zone visible on the chart. Breaking that area could completely change long-term market sentiment around $SOL.
What makes this setup powerful is the psychology behind it.
Large inverse head and shoulders patterns often represent: • Exhaustion of long-term sellers • Gradual accumulation • Return of confidence • Transition from fear to expansion
And because the structure develops slowly, many market participants fail to recognize the shift until price has already moved substantially higher.
That’s why patience becomes important here.
The chart is not screaming immediate euphoria yet. It’s signaling that a potentially major structural transition may already be underway.
If momentum continues improving and the neckline confirms as support, $SOL could end up becoming one of the strongest long-term reversal charts in the market heading into the next expansion phase.