LAB Coin Explodes Higher on Binance as Traders Watch for Next Breakout Move
LABUSDT Surges More Than 16% in 24 Hours
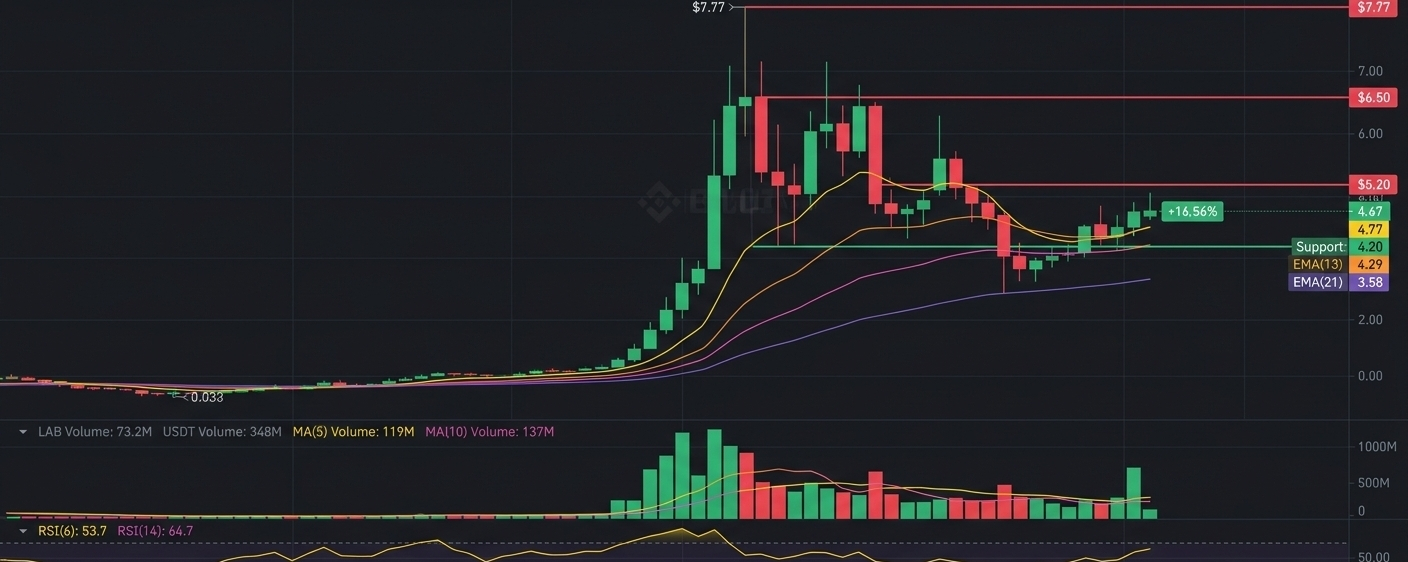
The cryptocurrency market witnessed another wave of explosive volatility after LAB (LABUSDT) posted a powerful rally on Binance Futures. According to the latest trading data shown on the daily timeframe, the token climbed to around $4.67, recording a strong 16.56% daily gain and attracting significant trader attention across the derivatives market.
The impressive move pushed LAB’s 24-hour trading volume above 95 million LAB, while USDT turnover exceeded $448 million, signaling intense speculative activity and growing momentum around the asset.
What makes the rally even more remarkable is the fact that LAB recently reached a local high near $7.77, creating one of the strongest short-term upward movements seen among trending altcoins this week.
Technical Structure Shows Strong Bullish Momentum
The chart structure suggests that LAB remains in a broader bullish trend despite the recent volatility and sharp corrections. On the daily timeframe, the token continues trading above several important exponential moving averages, which traders often use to determine market direction.
Current EMA levels visible on the chart include:
EMA(8): 4.77
EMA(13): 4.29
EMA(21): 3.58
The price action holding near these levels indicates that buyers are still defending the trend structure, even after the aggressive pullback from the recent peak.
The explosive vertical rally from below $1 toward the $7 region reflects strong speculative demand and a rapid increase in market participation. Such movements are commonly associated with newly trending crypto assets entering a high-volatility discovery phase.
Volatility Increases After Massive Price Spike
One of the most important details visible on the chart is the sudden increase in candle size and market volatility after the breakout phase began. LAB experienced multiple large bullish candles followed by equally aggressive corrections, highlighting intense battles between buyers and sellers.
The rejection from the $7.77 high suggests that early investors and short-term traders likely secured profits after the rapid surge. However, the asset still managed to stabilize above key psychological support around the $4 region.
This stabilization phase could become extremely important for the next directional move.
If bulls manage to maintain support above the EMA cluster, traders may attempt another push toward higher resistance zones. On the other hand, losing the current support region could trigger deeper retracements toward lower daily support levels.
RSI Signals Cooling Momentum But Trend Remains Active
The Relative Strength Index (RSI) on the chart shows that momentum has cooled after entering overheated territory during the parabolic move.
The visible RSI values include:
RSI(6): 53.7
RSI(14): 64.7
These readings indicate that LAB is no longer in extreme overbought conditions, which could potentially allow the market to reset before another attempt higher.
In many cases, aggressive crypto rallies require consolidation periods where momentum indicators cool down while the market absorbs profit-taking pressure. This appears to be exactly what LAB is currently experiencing.
Despite the retracement, RSI levels still remain relatively elevated compared to neutral market conditions, meaning bullish momentum has not fully disappeared.
KDJ Indicator Points to Short-Term Uncertainty
The KDJ indicator displayed on the chart suggests that short-term momentum has weakened compared to the earlier breakout phase.
The latest readings show:
K: 49.96
D: 60.30
J: 29.29
This configuration often reflects temporary bearish pressure or consolidation after strong rallies. However, in highly volatile crypto markets, such signals can quickly reverse if buying volume returns.
Traders are now closely watching whether the indicator stabilizes and turns upward again during the current consolidation range.
Trading Volume Remains Exceptionally High
One of the strongest bullish signals visible on the chart remains the elevated trading volume.
The chart shows:
LAB Volume: 73.2M
USDT Volume: 348M
MA(5) Volume: 119M
MA(10) Volume: 137M
Sustained high volume after a major breakout is often interpreted as confirmation that the market remains highly active rather than collapsing immediately after the initial move.
In cryptocurrency markets, strong volume usually plays a critical role in maintaining bullish momentum. Without volume support, sharp rallies frequently fade quickly. In LAB’s case, however, participation levels remain extremely elevated.
Market Sentiment Turns Highly Speculative
LAB’s rapid price expansion has transformed the asset into one of the most discussed speculative trading opportunities on Binance Futures.
Such explosive moves typically attract:
Momentum traders
Scalpers
Futures speculators
High-risk breakout traders
At the same time, volatility also increases liquidation risks significantly, especially for traders using excessive leverage.
The chart’s long wicks and large daily ranges indicate that both long and short positions are being aggressively challenged as the market searches for equilibrium after the vertical expansion phase.
Key Levels Traders Are Watching
Several important price zones are now becoming critical for LAB’s next move.
Resistance Levels
$5.20 region
$6.50 region
Previous peak near $7.77
Support Levels
$4.20 region
EMA(13) near $4.29
EMA(21) near $3.58
Holding above these support levels could strengthen the bullish structure and increase the probability of another upward continuation attempt.
Can LAB Continue the Rally?
The biggest question now is whether LAB can sustain its explosive momentum or if the market will enter a deeper correction phase.
Historically, crypto assets that experience rapid vertical rallies often move into periods of:
Sideways consolidation
Volatility compression
Sharp pullbacks
Secondary breakout attempts
The current chart suggests that LAB may be entering one of these consolidation stages following the aggressive run-up.
If overall crypto market sentiment remains positive and buyers continue defending higher lows, LAB could attempt another breakout cycle. However, traders should also remain cautious due to the extremely volatile nature of recently pumped assets.
Final Thoughts
LABUSDT has quickly become one of the standout performers on Binance Futures after delivering a massive multi-day rally and attracting hundreds of millions in trading volume.
Although momentum indicators suggest the market is cooling after the explosive breakout, the broader trend structure still appears bullish while the token trades above key moving averages.
The coming sessions will likely determine whether LAB enters a healthy consolidation phase before continuation or transitions into a larger correction after its parabolic rise.
For now, all eyes remain on whether bulls can defend the critical support zones and reignite momentum toward the previous highs near $7.77.
Source: 24crypto.news