
Stop Using Support & Resistance the Old Way
Most retail traders lose money because they draw their support and resistance lines wrong. They connect random wicks, guess at levels, and get stopped out over and over again.
There's a reason professional traders and institutions consistently win — they trade Demand and Supply Zones, not arbitrary lines.
Let me break it down simply, because once you understand this concept, you'll never look at a chart the same way again.
What Are Demand & Supply Zones?
Demand Zones are price areas where strong buying pressure previously overwhelmed selling pressure, causing price to shoot up sharply. Think of it as a zone where big institutions placed large buy orders. When price returns to that area, those unfilled orders are still waiting — and price reacts.
Supply Zones are the opposite — areas where heavy selling overwhelmed buying, causing price to drop sharply. Institutions left unfilled sell orders at those levels.
The key insight: price always returns to fill unfinished business.
The 3 Price Structures You Must Know
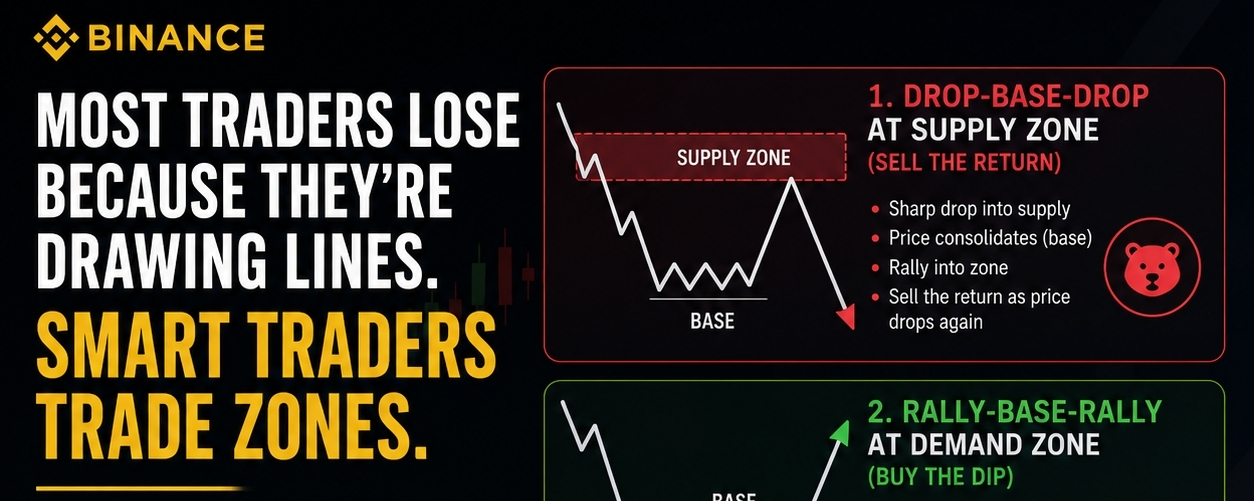
1. 📉 Drop-Base-Drop (DBD) — Continuation to the Downside
Price drops → consolidates briefly → drops again.
This is a Supply Zone. The consolidation "base" is where sellers loaded up. When price rallies back to that base, it's your sell opportunity.
2. 📈 Rally-Base-Rally (RBR) — Continuation to the Upside
Price rallies → consolidates briefly → rallies again.
This is a Demand Zone. Buyers loaded positions in that base. A pullback into this zone is a high-probability long entry.
3. 🔄 Drop-Base-Rally (DBR) — The Strongest Reversal Signal
Price drops → forms a base → reverses sharply higher.
The base formed here is an extremely strong Demand Zone because it flipped market sentiment completely. These produce the highest quality trade setups.
How to Trade These Zones — Step by Step
Step 1: Identify the Move
Look for a sharp, impulsive price move (not a slow grind). The bigger and faster the move, the more significant the zone.
Step 2: Mark the Base
The base (the consolidation candles just before the explosive move) is your zone. Mark the top and bottom of those candles — that's your demand or supply zone box.
Step 3: Wait for the Return
Do NOT chase the move. Let price retrace back into the zone.
Step 4: Look for Confirmation
Watch for rejection wicks, engulfing candles, or lower timeframe structure shifts inside the zone.
Step 5: Execute with Precision
Entry: Inside the zone (not below/above it)
Stop Loss: Just beyond the zone's far edge
Target: The next opposing zone (demand → nearest supply, supply → nearest demand)
Why This Works: The Institutional Logic
When large institutions buy millions of dollars worth of BTC or ETH, they can't fill their entire order at one price. Part of the order gets filled, price moves, then they wait for price to return to fill the rest. This is why zones work — they reflect real institutional order flow.
Retail traders see random bounces. Smart traders see unfilled institutional orders.
Common Mistakes to Avoid
❌ Trading weak zones — A zone that's been tested multiple times loses strength. Trade fresh zones only.
❌ Ignoring the trend — Trade demand zones in uptrends, supply zones in downtrends. Counter-trend trades are lower probability.
❌ Tight stop losses — Price can wick deep into a zone before reversing. Give it room.
❌ Marking every little base — Only zones formed from explosive, impulsive moves are valid. Slow consolidations don't count.
The Bottom Line
Demand and supply zones are not a magic formula — they're a framework for understanding where institutions are active in the market. Master this, and you stop being the person on the other side of the smart money trade.
Study the chart. Mark the zones. Wait for price to return. Execute with discipline.
The market rewards patience.
#AasimMajeedAMC #BTC #KnowledgeFi
