
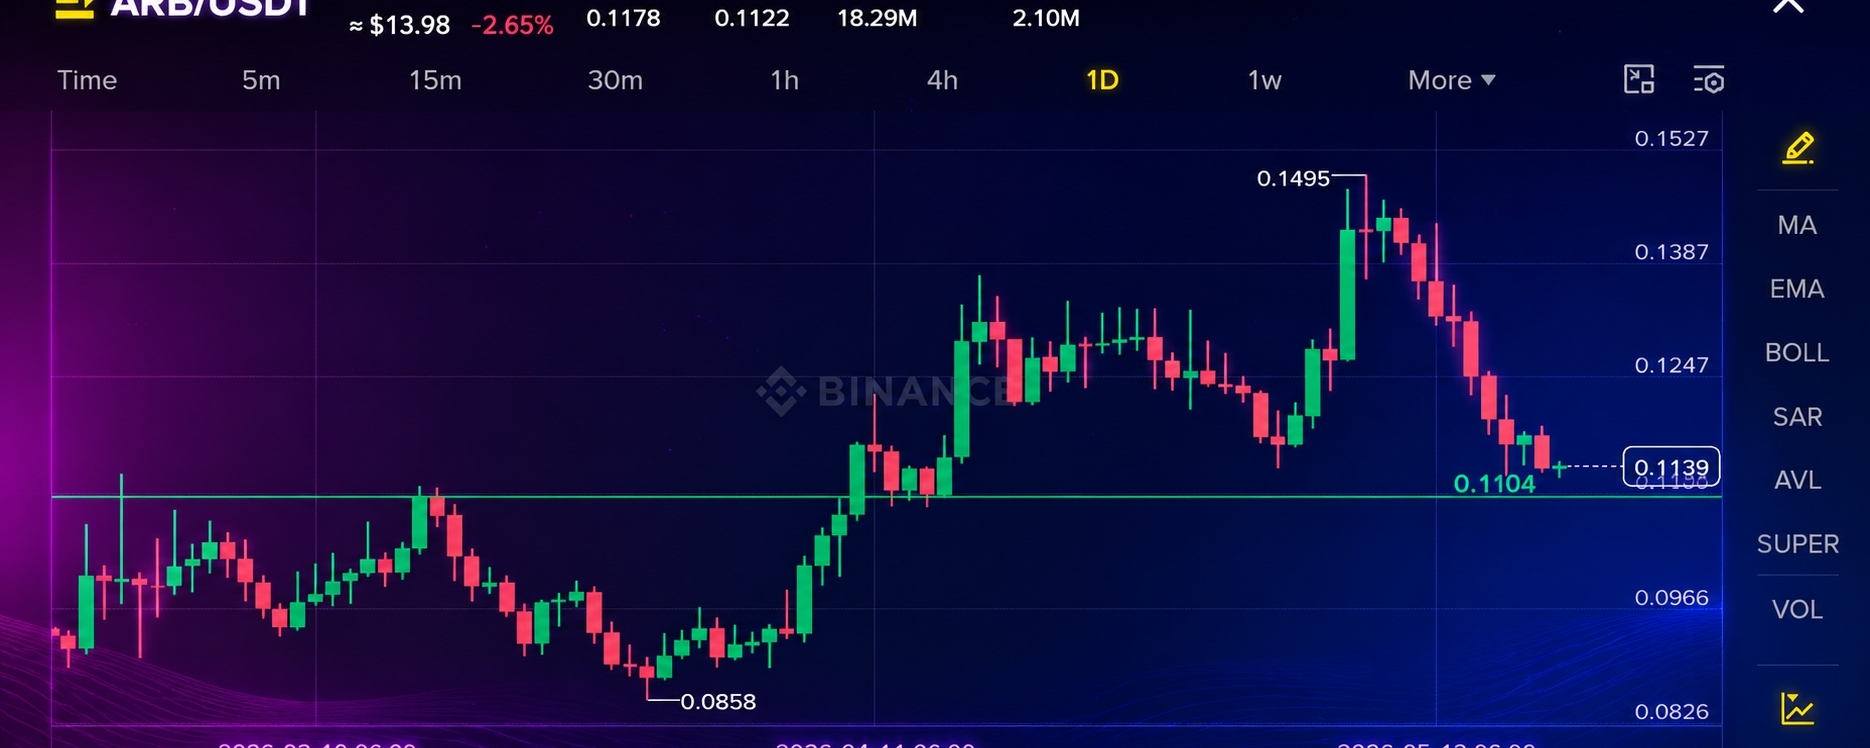
The daily chart for the ARB/USDT pair shows that the market is currently under short-term bearish pressure after failing to hold its recent bullish breakout. ARB recently surged from the $0.0858 support zone and rallied strongly toward the $0.1495 high, indicating aggressive buying momentum during the previous uptrend. However, after reaching that peak, sellers quickly entered the market, triggering a correction phase.
At the moment, ARB is trading near $0.1139, slightly below the important support level around $0.1104. The chart shows multiple consecutive red candles, which signals weakening bullish momentum and increasing selling pressure. If ARB fails to defend the $0.1100 area, the next possible downside targets could appear near $0.1000 and potentially the previous swing low around $0.0960.
On the bullish side, if buyers regain control and volume increases, ARB could attempt a recovery toward the resistance zones near $0.1247 and later $0.1387. A breakout above those levels may reopen the path toward the recent high at $0.1495.
Overall, the trend remains cautious in the short term. Traders are likely watching whether the current support can hold before deciding the next major direction. Volume and Bitcoin market sentiment may also play a major role in ARB’s next movement.