Just 5 minutes observation
Just take a look
Hello, crypto investors,
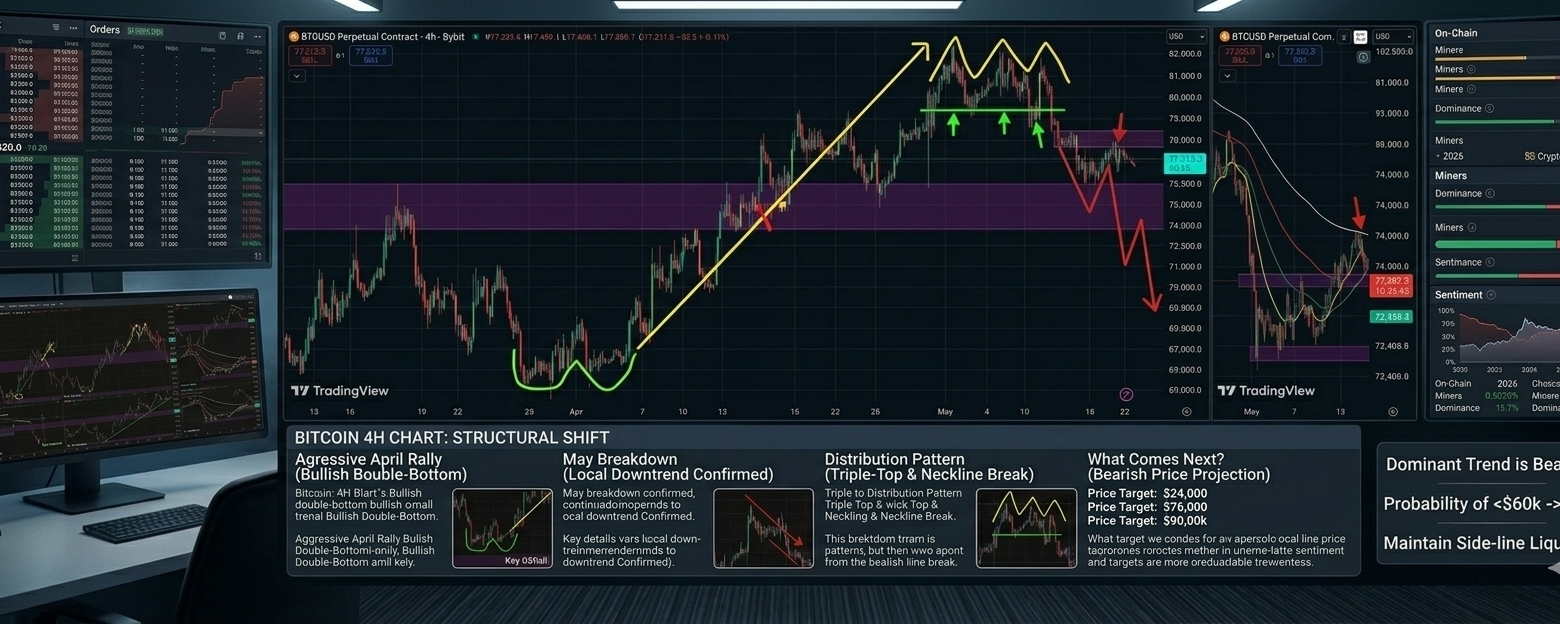
Bitcoin has held firm above $70,000 over the past few days following its sharp rejection at $82,000. Structurally, a lot has shifted on the BTC/USD chart that isn’t fully captured on the daily or weekly timeframes. To map out these changes, we zoom in on the 4-hour chart for this analysis to fully assess intra-day market activity.
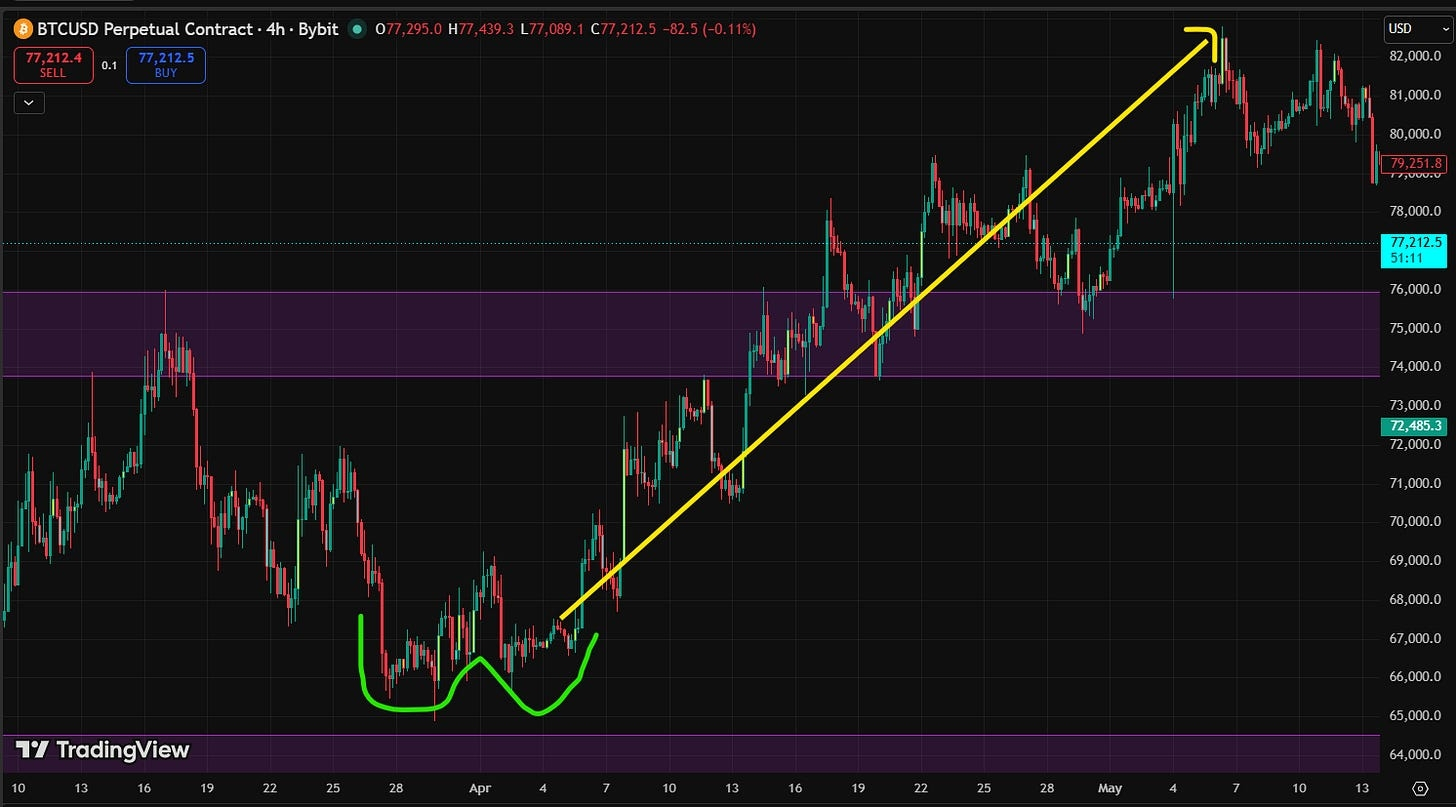
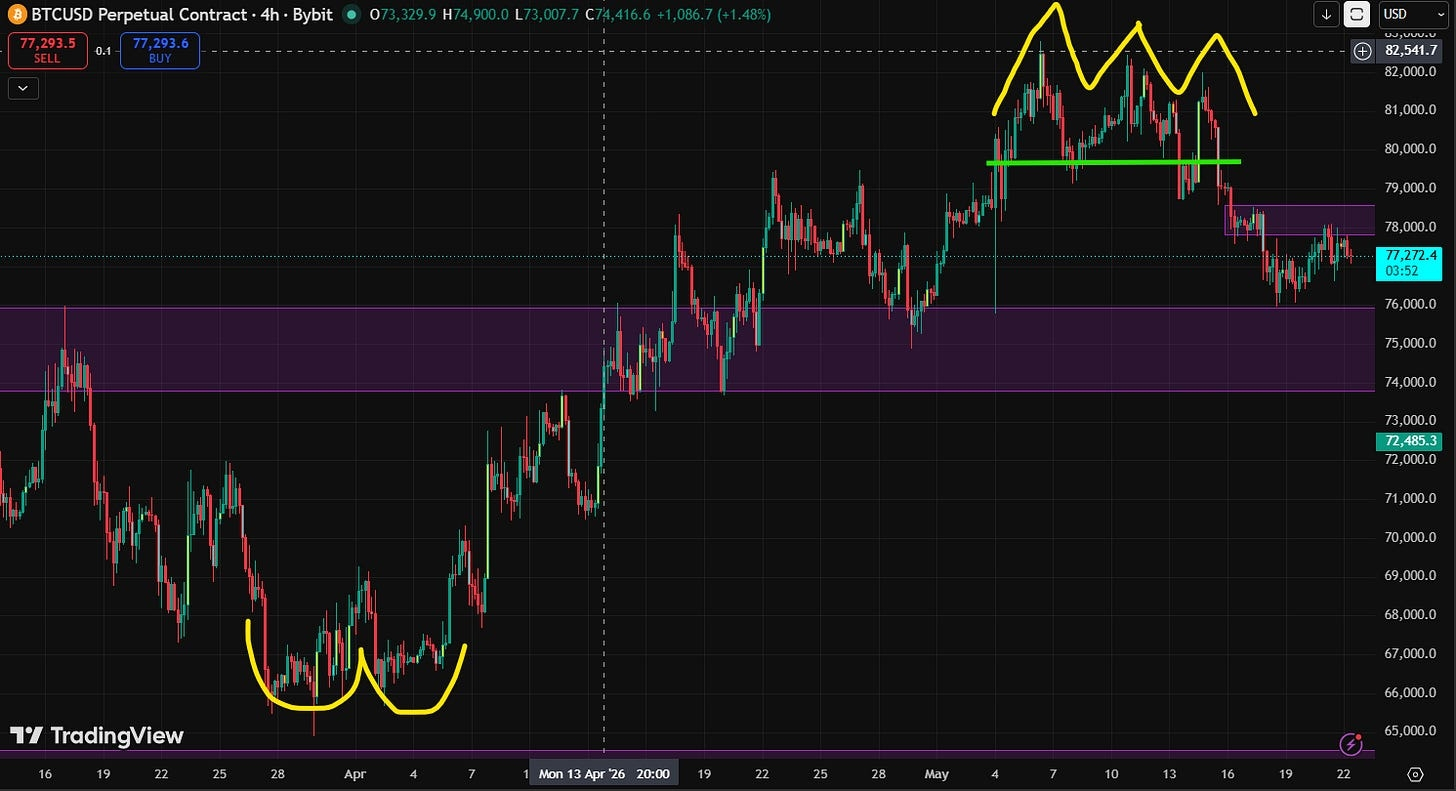
Looking at the data below, you can clearly see that Bitcoin enjoyed an aggressive run last month after confirming a bullish double-bottom pattern on the 4-hour timeframe. That impulse propelled the BTC/USD pair from around $65,000 in early April to its local peak near $82,800 in early May. (See the yellow arrow in the chart below.)
However, market conditions have shifted.
The momentum that propelled Bitcoin from the low-$60,000 zone to over $82,000 is officially exhausted. And yes, the BTC/USD pair has invalidated its bullish structure on the 4-hour timeframe, signaling that we must pivot from a short-term bullish sentiment to a defensive, bearish posture.
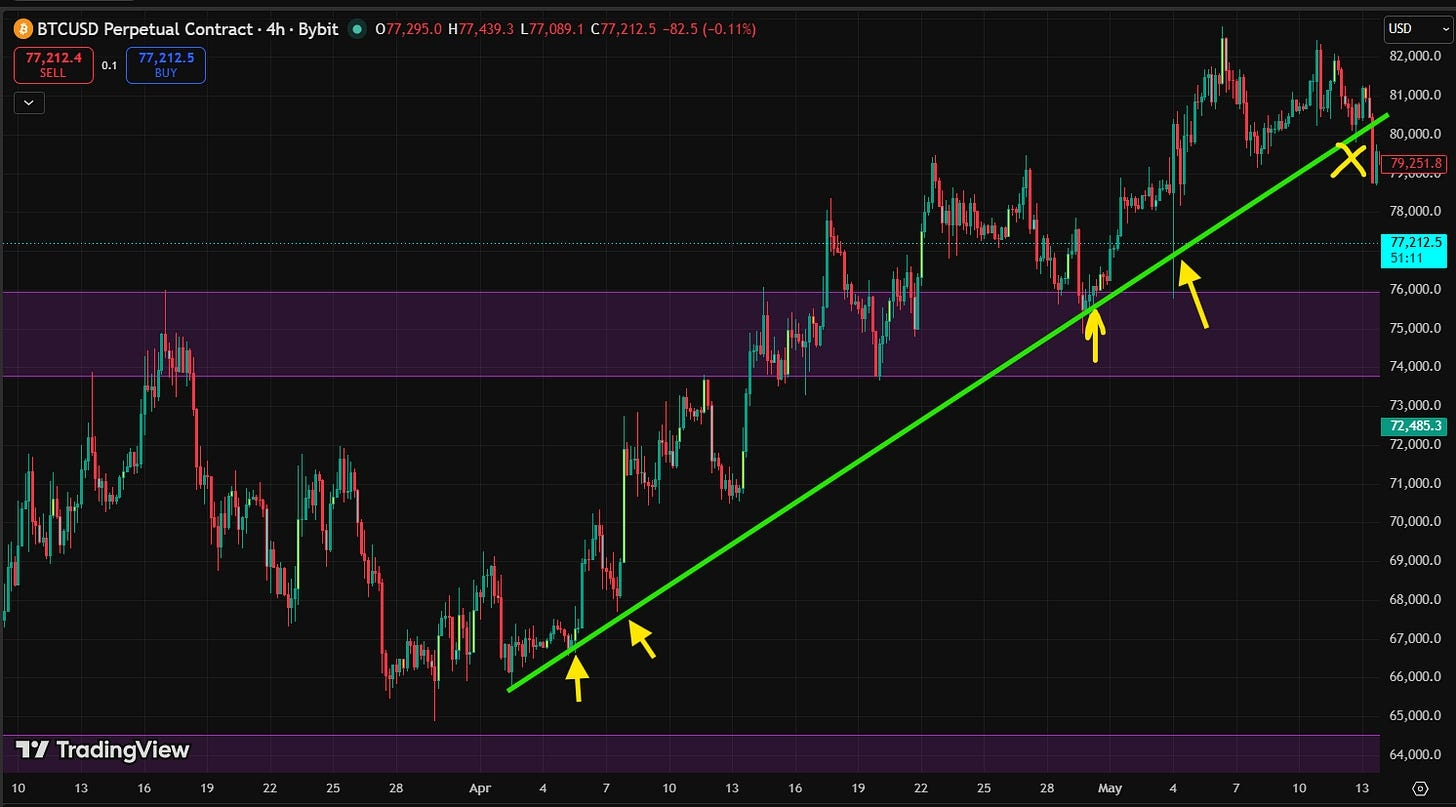
Please note: During the recent relief rally, the BTC/USD pair recorded a clean sequence of higher highs and higher lows, supported by sustained momentum, with the ascending trendline below serving as dynamic support. See the chart below.
That support has now cracked, confirming a definitive shift in trend and momentum. This breakdown indicates that Bitcoin has officially transitioned into a localized downtrend. (See the green line in the chart below.)
That’s not all…
What I have uncovered on the 4H chart—which the broader market is completely overlooking—is a classic distribution signal. It stands in direct contrast to the clean accumulation structure we saw in early April, which propelled Bitcoin from $65,000 to over $82,000. (See the yellow divergent lines in the chart below.) This represents a typical bearish trend reversal signal.
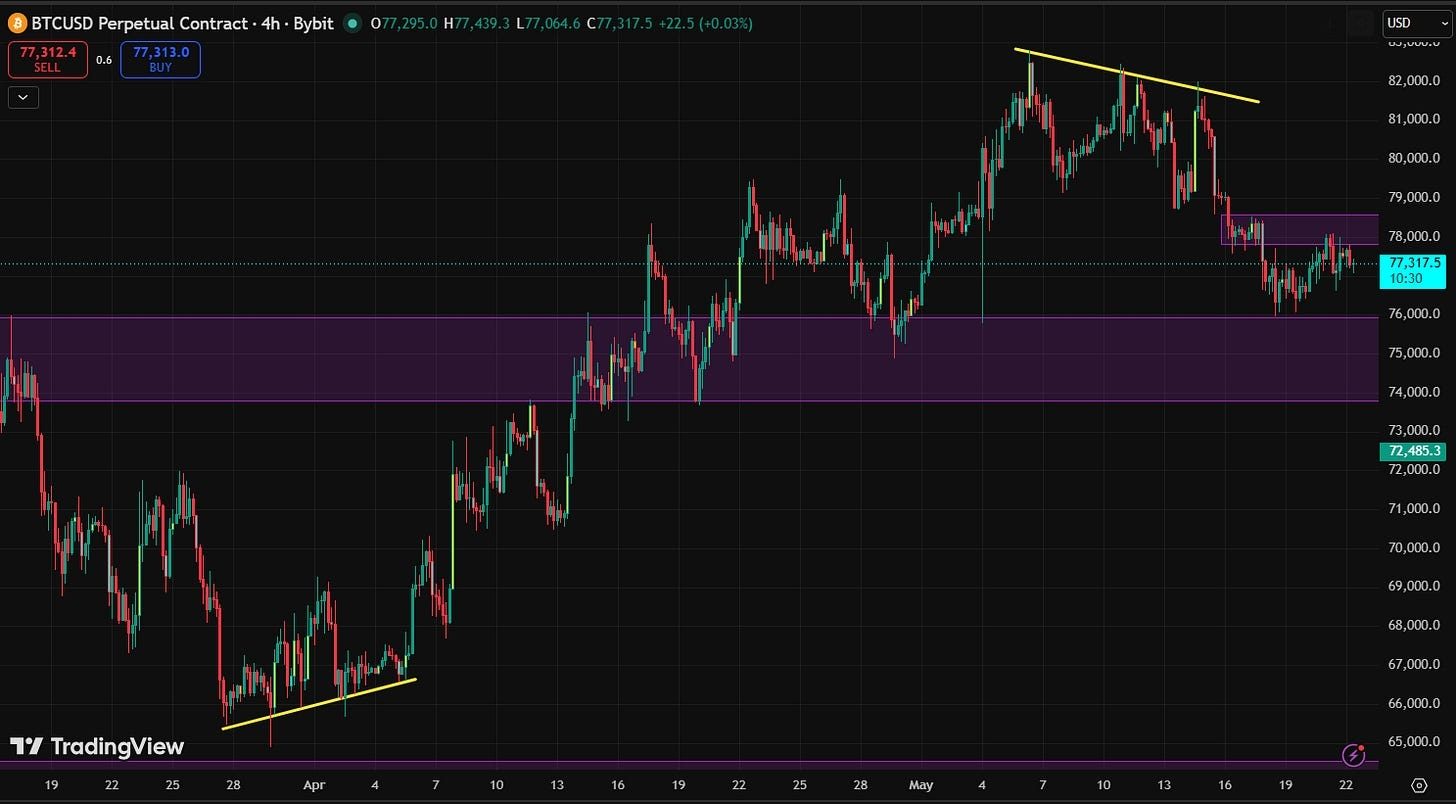
While Bitcoin printed a strong bullish double-bottom in early April, it has now formed a triple-top—a classic bearish reversal pattern. This structural shift is officially confirmed by a clean break below the key neckline at $79,600. (See the green line below.)
What Comes Next?
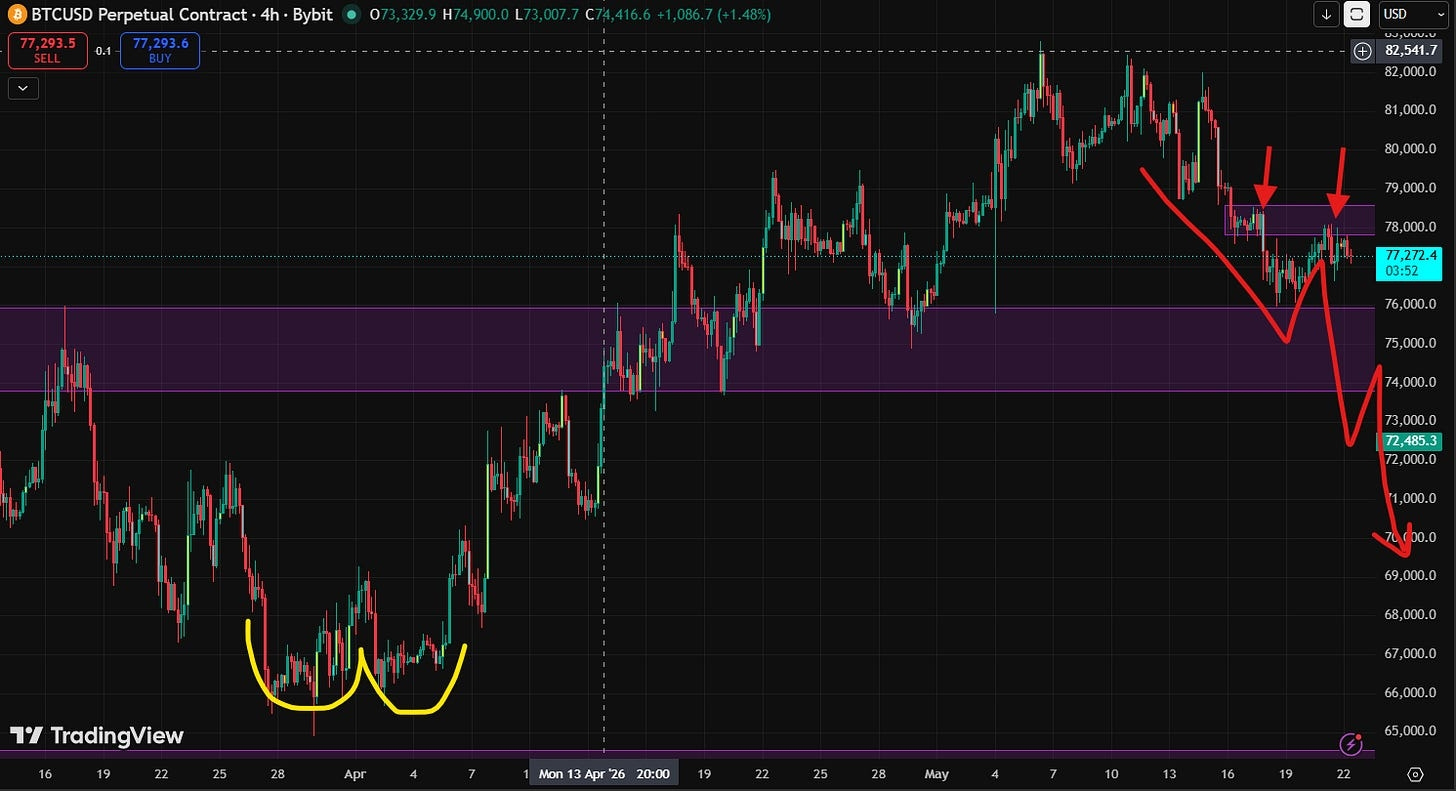
Well, this market update confirms that Bitcoin has locked in a bearish market structure, signaling a clear move to the downside. So, if sellers maintain control—mirroring the sustained momentum buyers displayed during the $65,000 to $82,000 rally—we could see a significantly deeper correction in the days ahead.
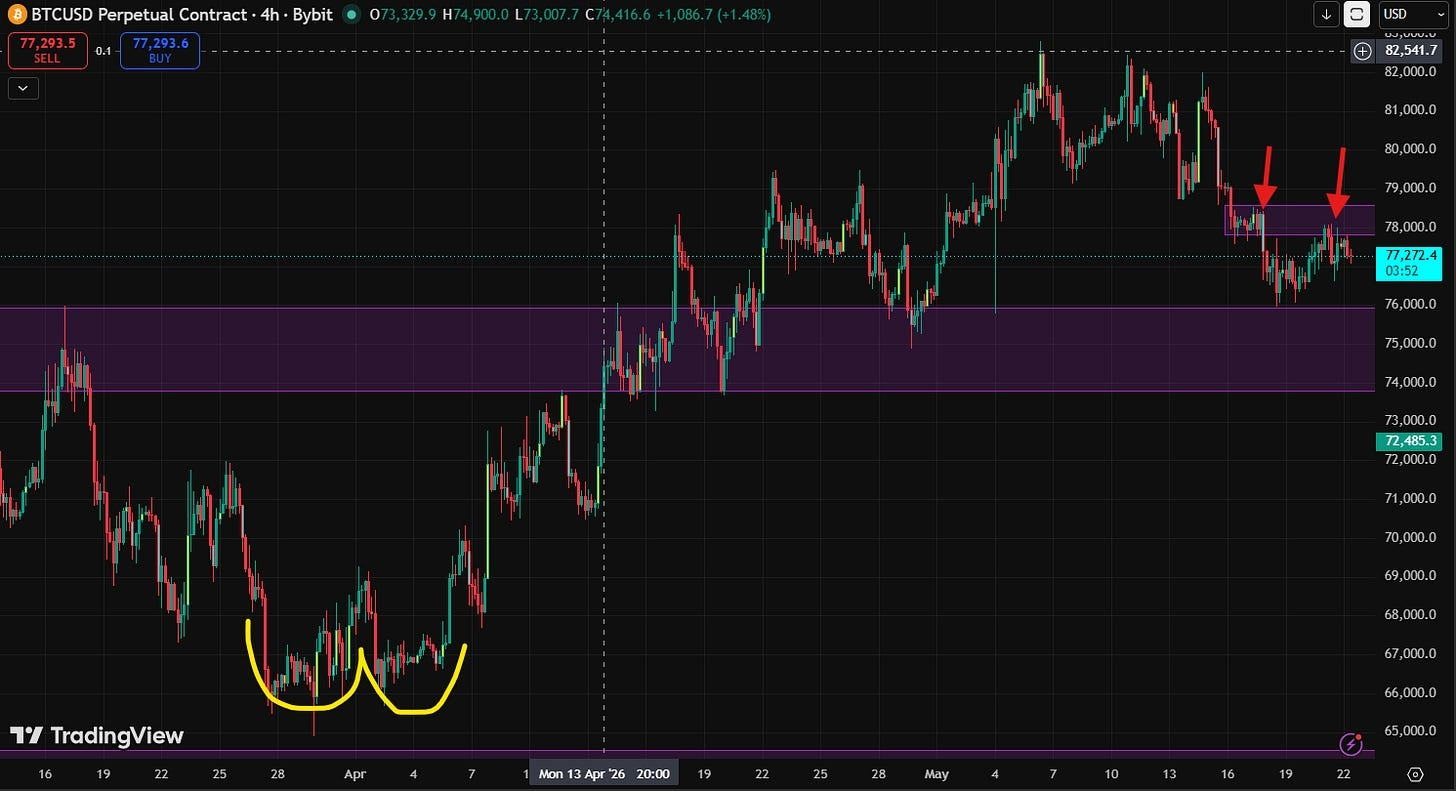
Currently, Bitcoin is trading beneath a minor resistance zone between $78,000 and $79,000. Before we flip bullish, it must decisively reclaim this area to demonstrate that buyers are returning to the market.
Failure to do so will likely trigger another leg down from $77,000, forcing Bitcoin to retest the lower boundary of our macro order block between $74,000 and $76,000. (See the red arrows and purple box illustrated below.)
This bearish continuation pattern aligns with our bearish sentiment on the weekly and daily timeframes.
As I have emphasized in previous updates, the probability of Bitcoin dropping below $60,000 is significantly higher than the probability of it trading above $90,000 in the short term.
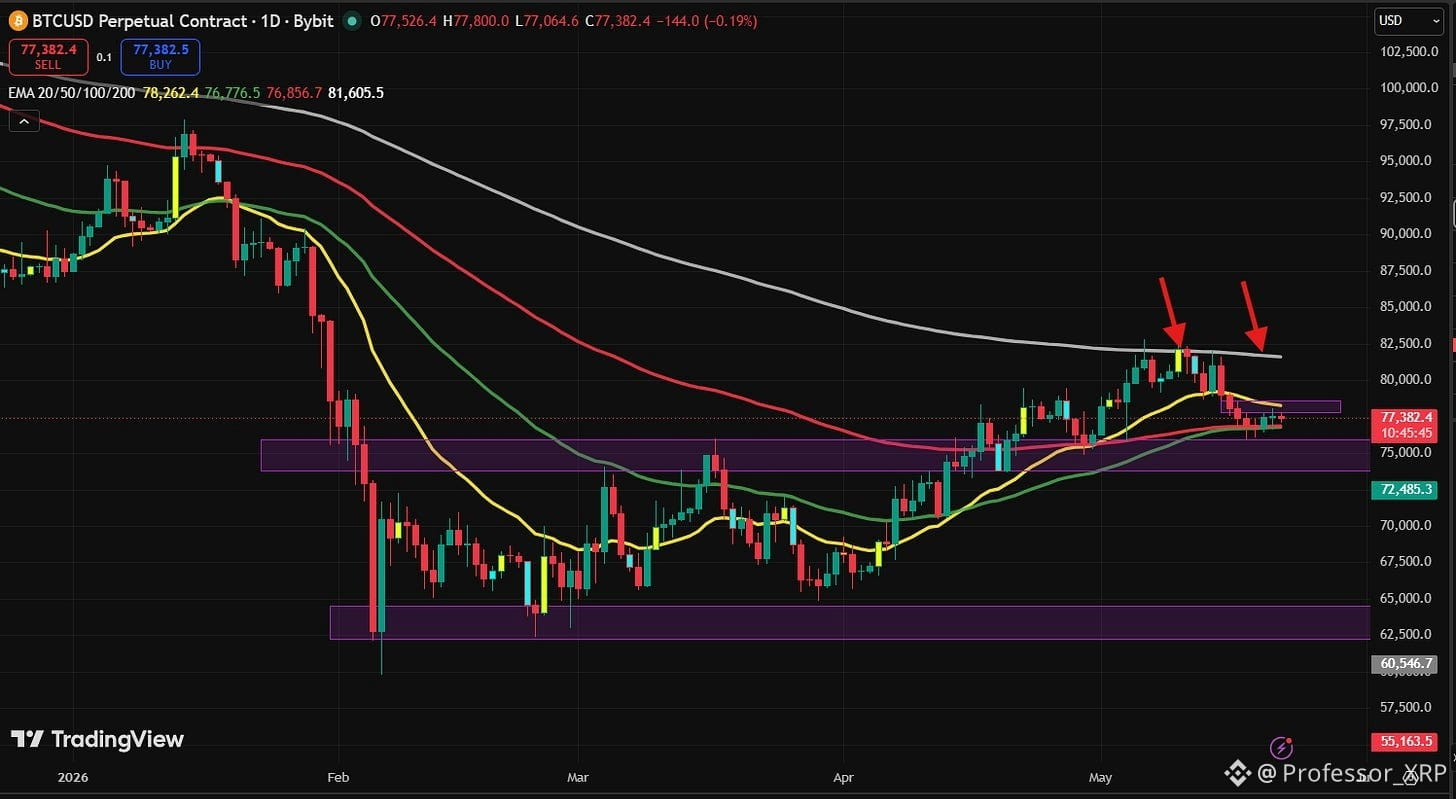
This remains true because Bitcoin is trading below its daily 200-period EMA. As long as price action respects this critical technical level, a projected move to the upside is considered dead on arrival. See the arrow in the chart below.
Now you can see why I continually advise building cash reserves on the sidelines—so you have the liquidity to deploy when the real generational bottom arrives. We aren’t there yet, but we aren’t far away either.
To be clear, we aren’t attempting to perfectly time the market.
We are simply aligning our capital with the dominant trend. If the market undergoes a sudden structural reversal, we will adapt immediately by shifting our bias back to bullish. For that to happen, Bitcoin must hold above $70,000, with the 50- and 100-period EMAs acting as support on the daily timeframe. See the chart above.
Remember, the market is dynamic, and the only way to maximize this cycle is to ruthlessly ride the trend—whether you are a trader or a long-term investor.
Given the structural breakdown on the 4-hour chart, I am leaning bearish and anticipate a much deeper correction in the days ahead. See the chart below.
What about you? Are you looking to buy at $77,000, or are you waiting on the sidelines for a drop below $60,000 before deploying capital? Let me know your thoughts in the comments below.