
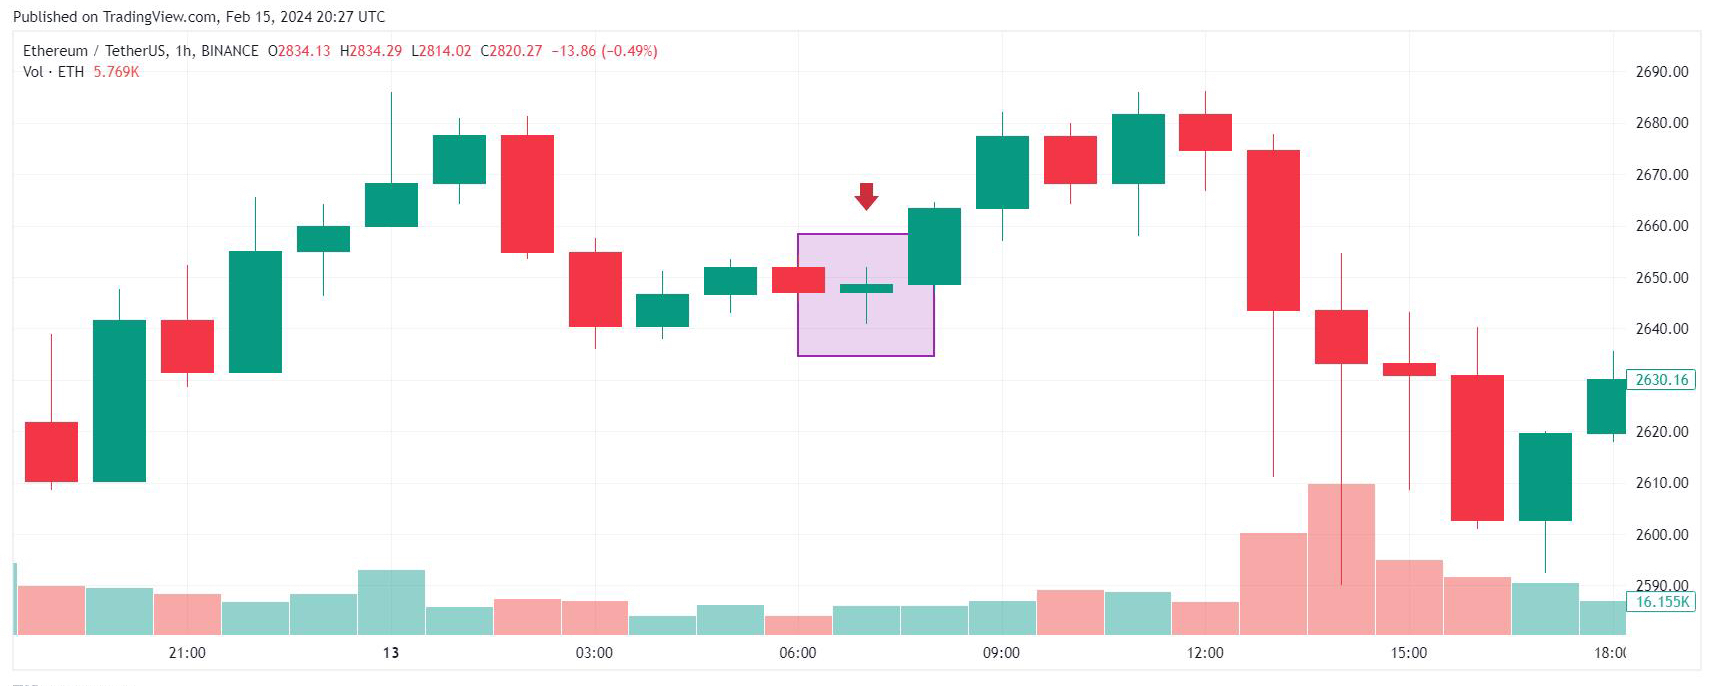
Ethereum is currently trading in a volatile consolidation range after a strong recovery attempt earlier this year. The daily candlestick structure shows indecision near key resistance levels, with buyers struggling to fully regain long-term bullish momentum. Recent market commentary points to a bearish pennant structure around the $2,100–$2,450 zone, which is often considered a continuation pattern.$ETH
Key Levels
Support: $2,100 → major breakdown zone
Resistance: $2,450 → breakout confirmation level
Bullish target: $2,650+ if resistance breaks cleanly
Bearish risk: Below $2,100 could trigger accelerated selling pressure
Candle Structure
Recent candles show:
Long wicks near resistance → sellers active at higher prices
Smaller-bodied candles → momentum slowing
Compression pattern forming → likely preparing for a breakout move
Indicators Snapshot
RSI remains near neutral territory
MACD shows weakening bearish momentum
Volume has declined during consolidation, which often precedes volatility expansion
Overall Bias
Short term: Neutral to slightly bullish
Medium term: Still structurally fragile until ETH reclaims higher moving averages
Traders are watching for either:
a breakout above resistance for continuation upward, or
a breakdown below support confirming bearish continuation.$ETH
 ETH2,111.79+0.98%