
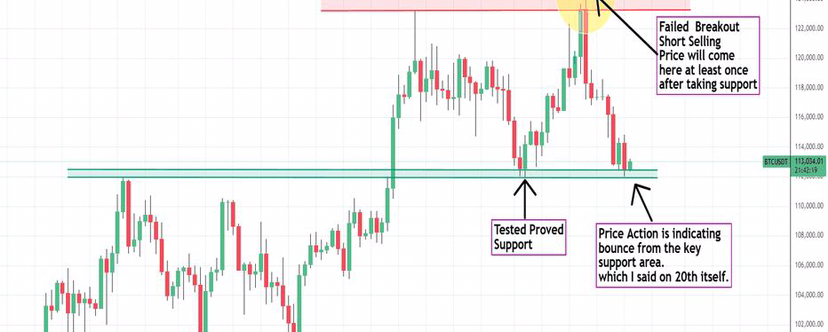
Bitcoin is currently trading in a high-volatility zone after a strong recovery from recent lows. The daily candle structure shows buyers defending key support levels while price attempts to break higher resistance.$BTC
Candle Structure
Recent candles show long lower wicks, indicating strong buying pressure during dips.
A series of higher lows suggests bullish accumulation.
Resistance remains around the recent swing-high zone, where sellers previously rejected price.
Key Levels
Support: $64K–$66K zone
Resistance: $70K–$72K zone
A clean candle close above resistance could trigger continuation toward new highs.
Momentum
RSI has recovered from oversold conditions, showing improving momentum.
Volume expansion on green candles suggests buyers are returning to the market.
Overall Bias
Short-term: Neutral to bullish
Medium-term: Bullish if BTC holds above major support and confirms breakout with strong candle closes.
Traders are watching for either:
A bullish breakout candle above resistance, or
A rejection candle signaling another correction phase.
Recent technical reports also note BTC forming consolidation and breakout patterns after earlier volatility$BTC
