
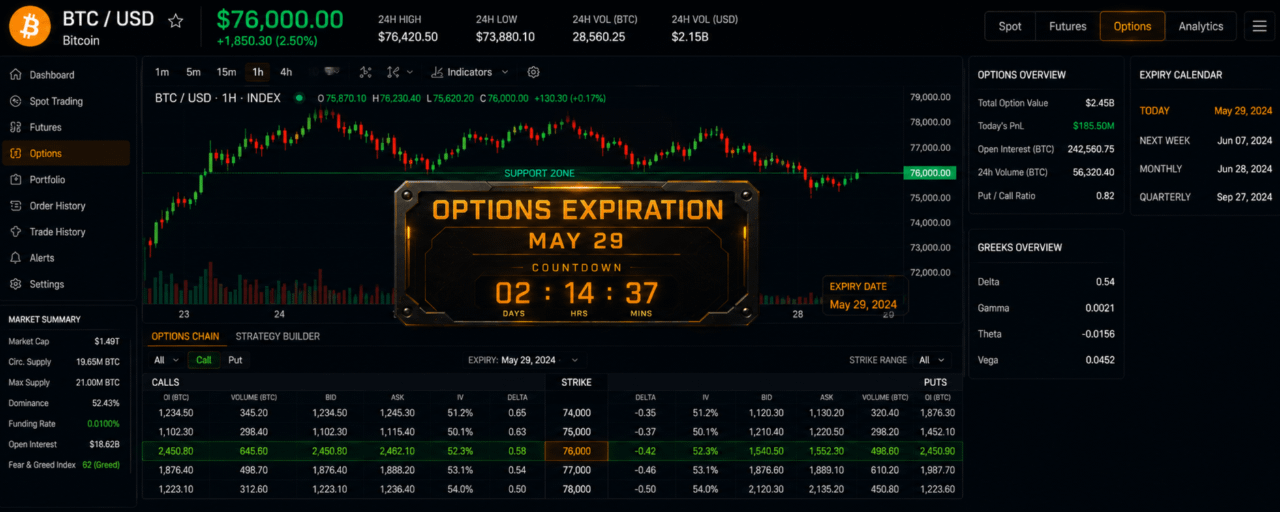
The global cryptocurrency market is standing at a critical structural crossroad this week. After facing an aggressive rejection at the $83,000–$85,000 heavy resistance wall, Bitcoin ($BTC ) has undergone a swift correction down to the $76,000 range, re-igniting extreme fear across retail derivative desks.
With $6 Billion worth of monthly options contracts expiring on May 29, open interest metrics show that institutional traders are locking in massive bets. Here is the data-driven breakdown of the macro forces shaping the next market expansion.

1. The Institutional Shift: BlackRock ETF Outflows & Macro Pressure
One of the primary catalysts behind the recent cooling-off period is a historical shift in institutional fund flows. Data confirms that BlackRock’s IBIT along with other spot Bitcoin ETFs recorded one of their largest single-day redemptions, marking an end to weeks of continuous baseline inflows.
This outflow is highly correlated with external macroeconomic factors:
Bond Market Interference: The U.S. 10-year Treasury yield recently surged to a critical yearly high, drawing risk-off liquidity out of volatile tech assets and crypto protocols back into traditional safe havens.
The Fed Transition Skepticism: As the Federal Reserve prepares for potential leadership transitions (with markets closely monitoring policy updates from figures like Kevin Warsh), institutional desks are temporarily de-risking their portfolios ahead of inflation guidance metrics.
2. Technical Blueprint: The Cup-and-Handle Pattern vs Liquidity Pools
Despite the immediate bearish sentiment and over $660 Million in leverage liquidations, high-timeframe structural charts are forming a fascinating bullish setup:
• The Hidden Price Structure: On the 4-Hour interval, Bitcoin is currently carving out a massive Cup-and-Handle pattern, a classic technically bullish formation.
• The Validation Mark: To confirm this pattern and target an immediate breakout toward $79,700, bulls must print sequential daily candle closes above the $78,000 psychological baseline.
• The Downside Floor: Failure to maintain momentum above the internal handle structure will invalidate the bullish narrative. If the current $76,000 structural floor snaps, the doors open wide for a deeper swipe down into the major institutional liquidity block resting at $71,500.
3. Smart Money Action: Whales Staking Big on $82,000 Calls
Interestingly, derivatives options data shows that whales are using this temporary panic as an accumulation window. Despite the spot market correction, options traders have piled heavily into $82,000 Bitcoin call options expiring at the end of May.
This tells us that while short-term retail leverage is being systematically flushed out, long-term capital allocators view the $76,000 horizontal support as a premium "Buy the Dip" zone.
💬 The Debate: Where Will BTC Close on May 29 Expiry?
The options open interest layout indicates an inevitable high-volatility expansion. Will the bears force a systemic breakdown below $74k, or will the $82k call options buyers take complete control of the tape?
• Drop your target numbers in the comment section below!
• Hit the Follow button for live, up-to-the-minute trade setups and alpha metrics.
