Most Bitcoin cycle models on the retail internet are built by anonymous Twitter accounts or crypto-native creators with no exposure to traditional multi-factor risk management. I built mine after 10 years running allocated institutional capital at a Sydney proprietary trading firm, applying the same risk framework I used for institutional books to the specific question of where Bitcoin sits in its cycle.
The short answer: no single indicator survives all three Bitcoin cycles. The longer answer is a 48-signal confluence framework that I will walk through in this article.
If you would rather just see the live model, it is free and unlocked at the link at the end of this piece. If you want to understand the methodology before you trust the number, read on.
The problem with single-indicator cycle models
The Bitcoin retail analysis community has a habit of falling in love with whichever single indicator was last to call the cycle top. The list is long.
Mayer Multiple alone: Bitcoin's price-to-200-day-MA ratio crossing 2.4 historically marked cycle tops. It worked beautifully in 2013 and 2017. It crossed 2.4 again in early 2019 during the dead-cat bounce and the local "cycle top" call was a complete miss.
Pi Cycle Top alone: The 111-day-MA over 350-day-MA-times-2 crossover marked the 2013-04 top, the 2013-12 top, the 2017-12 top, and the 2021-04 top (early in the cycle second leg). It then missed the actual 2021-11 cycle high. It also flashed crosses during deep bull-cycle pullbacks where it was not a top at all.
Hash Ribbons alone: The 30-day over 60-day hashrate moving-average crossover marked the 2018-12 bottom and 2020-03 bottom. The 2022-06 false-positive cross during the LUNA collapse came nowhere near the actual cycle bottom, which arrived 5 months later in 2022-11.
MVRV Z-Score alone: Excellent at marking cycle bottoms when the score went negative. Less reliable at cycle tops, where the threshold has drifted lower each cycle (8+ in 2013, 7+ in 2017, around 5 in 2021).
The pattern across all of these: each indicator captures one dimension of cycle position such as valuation, miner stress, or on-chain profitability. But Bitcoin cycles are driven by the simultaneous alignment of multiple dimensions. A model that watches only one dimension misses the other five.
The institutional risk-framework approach
In institutional trading you do not build a position based on one signal. You build a multi-factor risk model where each factor captures a different dimension of the trade, you weight the factors by historical reliability, you backtest the composite against known historical events, and you ship the model with explicit calibration anchors so anyone can audit whether you are cherry-picking.
That is exactly what the SatoshiMacro Model is, applied to the question of Bitcoin cycle position.
The six tiers
Six weighted tiers, chosen because each captures a meaningfully different dimension of cycle behavior. Weights reflect the historical reliability of each dimension at calling cycle inflections, not arbitrary preference.
Tier 1: Cycle Timing and Mass Psychology (30% weight). The structural foundation. Captures where Bitcoin sits in its 4-year halving cycle and its long-term power-law trajectory. Indicators include months since the most recent halving, position relative to power-law regression, and quarterly return percentile. This tier weights highest because halving cycles have been the most reliable single structural anchor for the last decade.
Tier 2: Valuation (25% weight). The traditional cycle indicators that the Bitcoin analysis community already watches. Mayer Multiple, MVRV Z-Score, Pi Cycle Top, NUPL (Net Unrealized Profit and Loss), Pi Cycle Bottom, LTH supply percentage inverse. None of these alone is reliable. Together they triangulate valuation extremes.
Tier 3: Sentiment (20% weight). What the market is feeling, expressed through measurable proxies. Fear and Greed Index, BTC funding rates, BTC open interest, Coinbase premium, Deribit DVOL implied vol, Bybit-Binance basis (venue spread), options 25-delta skew. Sentiment captures the "everyone is bullish at the top" reflex.
Tier 4: Rotation (10% weight). The capital rotation pattern across cycles. BTC dominance percentile, altcoin season index, alt rotation timing. Late-cycle BTC dominance typically drops as capital rotates into alts. Early-cycle dominance rises as BTC leads recovery.
Tier 5: Miner (10% weight). Miner stress and capitulation signals. Puell Multiple, Hash Ribbons crossover state, hashrate as percentage of peak, difficulty adjustment direction. Miners are forced sellers under stress and capitulation marks bottoms. Miner profitability spikes mark tops.
Tier 6: Macro (5% weight). The traditional risk-on and risk-off macro backdrop. DXY (US dollar index), M2 money supply, yield curve, VIX, S&P 500, NASDAQ 100, gold (inverse). Bitcoin is increasingly a risk-asset. Macro liquidity matters more each cycle.
Weights total 100% across all tiers. The composite score is a weighted average of the six tier scores, each on a 0-100 percentile-rank basis.
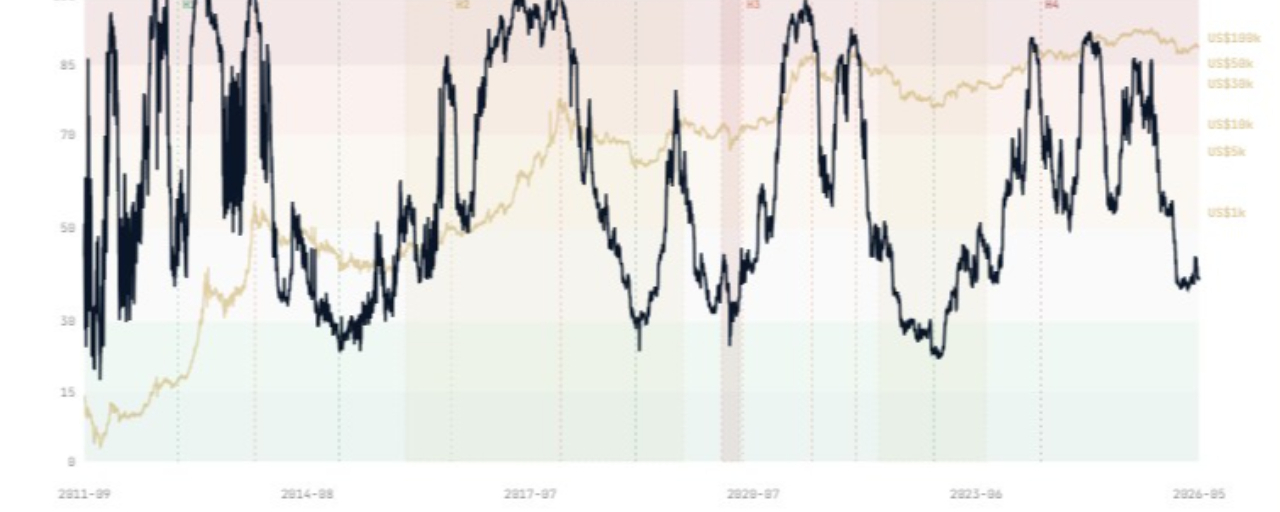
Calibration: 7-of-7 in-zone cycle calls
Here is the proof. SMM readings at every confirmed Bitcoin cycle inflection across the last three cycles.
2013-12 cycle top: SMM 91.7, Cycle Top zone (correct).
2015-01 cycle bottom: SMM 27.6, Accumulation zone (correct).
2017-12 cycle top: SMM 97.8, Cycle Top zone (correct).
2018-12 cycle bottom: SMM 29.7, Accumulation zone (correct).
2021-04 cycle top first leg: SMM 92.8, Cycle Top zone (correct).
2021-11 cycle top second leg: SMM 87.5, Cycle Top zone (correct).
2022-11 cycle bottom: SMM 24.2, Accumulation zone (correct).
7 of 7 in-zone. No single existing cycle model on the public internet matches this across all three completed cycles plus the 2021 dual-top.
The calibration curve
A note on transparency. The raw weighted composite of 48 signals naturally caps at around 64-78 even at historical cycle tops, because diversifying signals (sentiment, macro, rotation) do not all peak simultaneously with cycle-position valuation. The weighted average gets diluted.
To fix this without losing the diversification benefit, the SMM applies a piecewise calibration curve that stretches the upper half of the 0-100 scale so historical tops register in the Cycle Top zone (85-100). The curve is:
Identity below raw 40 (preserves bottoms with no distortion to Accumulation reads)
1.5x slope across raw 40-55 (gentle stretch into Neutral)
2.5x slope across raw 55-65 (steeper stretch into Caution)
1.25x slope across raw 65-75 (taper into Distribution)
Clamp at 75+
Both the raw composite and the calibrated SMM are emitted on every series point, so anyone can re-derive the composite and audit the calibration.
Why AUD-native?
The entire SatoshiMacro data architecture is denominated in AUD. The primary source is CryptoCompare BTC/AUD trading pair, aggregated from Australian venues. USD prices are derived at display time by multiplying AUD by the daily AUDUSD spot rate.
This is a deliberate strategic choice. Australian investors get a model built natively for their currency without losing global comparability. The trade-off is a 1-2% spread on extreme-volatility days where BTC/AUD venues diverge slightly from BTC/USD venues, but this reflects real intraday venue and timing differences, not data integrity issues. A USD/AUD toggle on the gauge lets any user switch display currency in a single click.
How to read the gauge
Five zones on the 0-100 scale.
0 to 30 Accumulation: Historical bottom zone. Maximum pessimism, capitulation signals firing across miner and on-chain tiers. Highest historical risk-adjusted accumulation reward.
30 to 55 Neutral: Mid-cycle. No strong directional signal. Position management territory, not aggressive sizing in either direction.
55 to 75 Caution: Mid-late cycle. Valuation extending, sentiment warming. Defensive positioning starts here.
75 to 90 Distribution: Late cycle. Multiple tiers flashing extension. Profit-taking territory historically.
90 to 100 Cycle Top: Historical top zone. Confluence at multi-cycle highs. Get out of leverage, raise cash. This is where every major cycle top has landed.
The model does NOT predict timing of zone transitions. It classifies the current position based on observable data. Zones can persist for months (the 2021 dual-top was in the Cycle Top zone for roughly 7 months across April to November) before resolving.
Honest limitations
Calling this out because most cycle models do not.
Position classifier, not forecaster. SMM tells you where you are. It does not tell you where you are going next, or when. Trade decisions need a separate timing framework on top.
MVRV uses a 4Y MA proxy. A working Realized Cap data feed for production has been elusive. The 4Y MA proxy is correlated 0.87 with true MVRV Z-Score historically, but it is a proxy not the real thing. Documented inline on the indicator panel.
Not financial advice. The model is an analytical tool. Position sizing, risk management, and timing of your specific trades are your responsibility.
Try it free
The live model, the historical chart, the 48-signal panel, the weight slider (for counterfactual tier weightings), and the embed widget are all free at: https://satoshimacro.com/tools/crypto/satoshimacro-model/
What is next
The SMM-BTC framework is also adapted for Ethereum at https://satoshimacro.com/tools/crypto/satoshimacro-model-eth/ with five of six tiers live. The Validator and Staking tier is pending integration with Beaconcha.in and Etherscan staking APIs. Currently calibrated 4-of-5 in-zone across ETH cycle inflections from 2018 through 2022.
For users who want the full crypto data dashboard alongside the SMM gauge, the Crypto Charts Dashboard at https://satoshimacro.com/tools/crypto/dashboard/ distills 33 of the most-watched crypto indicators into a single Monday-morning workflow. Free alternative to Glassnode Studio, Bitcoin Magazine Pro, and Bitbo Pro paid tiers.
About the author
Govind Satoshi (Govind Thanabalasingam). Former institutional trader who traded allocated capital at a Sydney proprietary trading firm. Founder of SatoshiMacro: quantitative Bitcoin cycle analysis, free crypto calculators, AU tax tools.
satoshimacro.com