
Looking closely at the 1-hour chart of $ETH /USDC on Binance, Ethereum is showing some very intense price action.
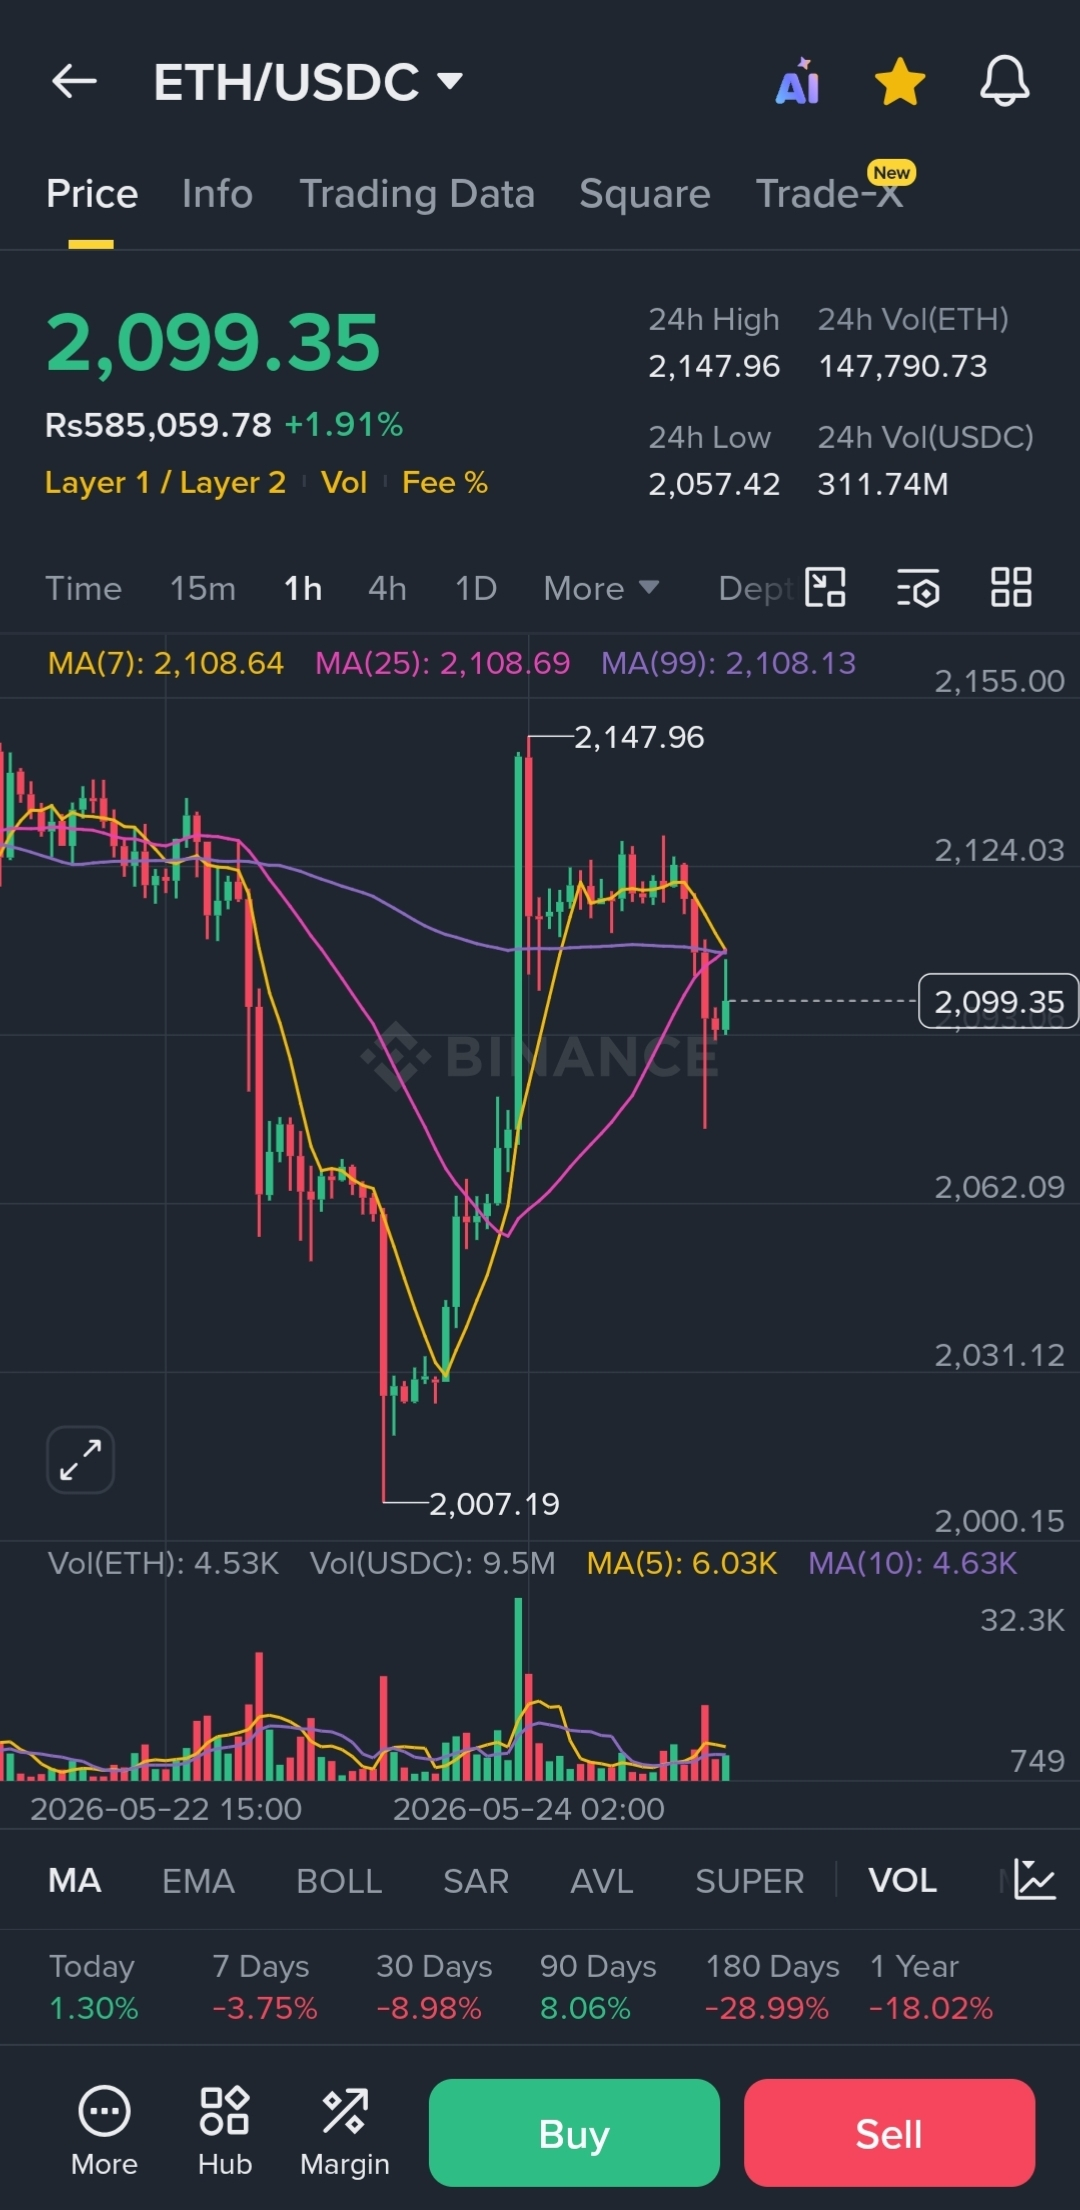 After hitting a local high of 2,147.96, we saw a sudden rejection, and $ETH is currently trading around 2,099.35.
Let’s break down what the technical indicators are telling us right now and where the price is heading next!
📊 1. The Key Levels to Watch
The Strong Support: A few sessions ago, $ETH dumped straight down to 2,007.19, where buyers aggressively stepped in. This tells us there is massive buying pressure near the $2,000 psychological zone.
The Resistance Zone: The moving averages (MA7, MA25, and MA99) are currently flattening out right above the price line around 2,108. This acts as a short-term ceiling that ETH needs to break to regain bullish momentum.
🔍 2. Market Sentiment: Accumulation or Trap?
The volume bars at the bottom show that the biggest volume spike happened right during the recovery from the $2,007 bottom. This indicates smart money (Whales) protected the $2,000 level. However, the current consolidation shows that the market is waiting for a clear direction before the next big move.
💡 Trading Strategy:
Bullish Scenario: If ETH daily or 4-hour candle closes above 2,110, we can expect a quick retest of 2,147 and potentially higher.
Bearish Scenario: If the price breaks below the immediate support of 2,060, we might see another sweep of the 2,007 liquidity zone before any real reversal.
⚠️ Reminder: Volatility is high, and trading without a tight Stop-Loss right now is highly risky. Protect your capital!
What is your play here? Are you buying the dip or waiting for a cleaner breakout? Drop your targets below! 👇
#Ethereum #ETHUSDANLYSIS #TechnicalAnalysis #CryptoTrading #BinanceSquare