#OpenLedger
Introduction-#OpenLedger
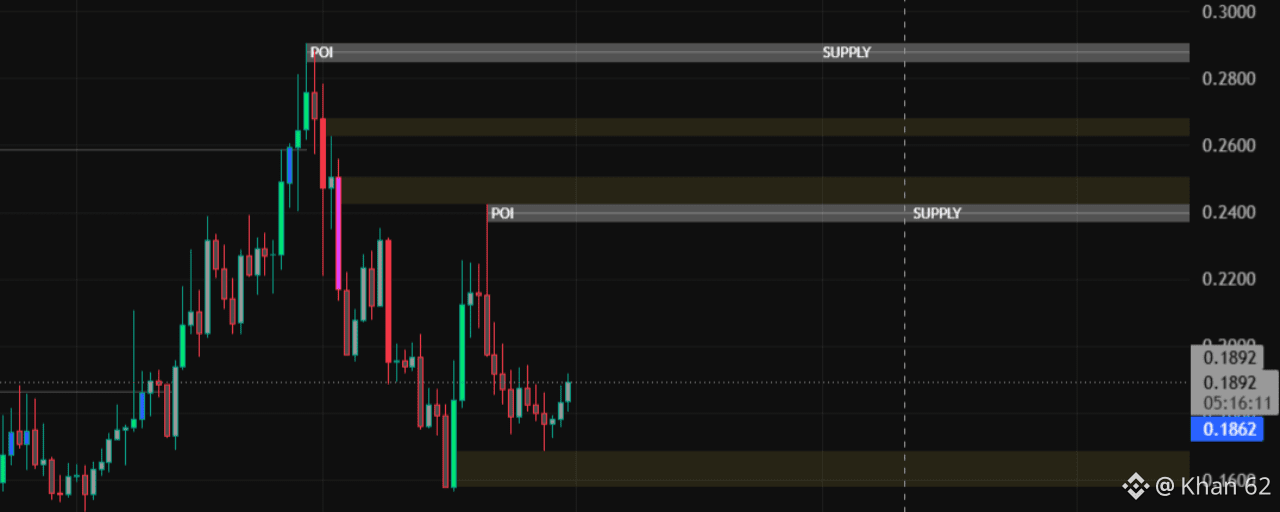
$OPEN has recently attracted the attention of traders as market activity and derivatives participation continue to increase. Trading around $0.19, the token is attempting to recover from a corrective phase while maintaining support above a critical demand zone. The latest chart structure provides valuable insights into potential future price movements and areas traders should monitor.
Current Market Structure
The chart shows that #open experienced a strong rally that pushed the price toward the $0.28–$0.29 supply zone. However, sellers aggressively defended this region, resulting in a significant pullback. Since then, the price has been forming lower highs and lower lows, reflecting short-term bearish pressure.
Despite the correction, buyers successfully defended the $0.14–$0.16 demand zone, preventing a deeper decline. This reaction indicates that market participants still view lower prices as attractive accumulation opportunities.
Key Support Levels
The most important support area remains between $0.14 and $0.16. Historically, this region has attracted strong buying interest and acted as a foundation for previous upward moves.
If $OPEN remains above this demand zone, the probability of a recovery increases significantly. A successful defense could encourage new buyers to enter the market, potentially fueling another upward leg.
However, if this support fails, bearish momentum could accelerate as traders exit positions and liquidity seeks lower levels.
#resistance Zones to Watch
Several resistance levels stand between OPEN and a larger bullish reversal.
First Resistance: Around $0.24
Second Resistance: Around $0.26
Major Supply Zone: Between $0.28 and $0.29
The price has already shown sensitivity to these levels. A breakout above $0.24 would be an encouraging sign that buyers are regaining control. If momentum continues and the token pushes through the upper supply zone, market sentiment could shift strongly in favor of bulls.
Derivatives Data Insights
One of the most notable developments is the 41% increase in Open Interest. Rising Open Interest often signals growing market participation and increased speculative activity.
This metric alone is not inherently bullish or bearish. Instead, it indicates that traders are actively positioning themselves for a larger move. Combined with price action, it can provide clues about future direction.
If Open Interest continues rising alongside price appreciation, it may confirm bullish conviction. Conversely, if Open Interest rises while price weakens, it could suggest aggressive short positioning or increased market uncertainty.
Bullish Scenario
For bulls, the ideal setup would involve:
Holding above the $0.16 support area.
Breaking above $0.24 resistance.
Increasing trading volume.
Sustained growth in Open Interest.
Stronger overall crypto market sentiment.
Under this scenario, OPEN could target the higher resistance zones around $0.26–$0.29, with the potential for a broader trend reversal.
Bearish Scenario
For bears, the focus remains on preventing a breakout above resistance. Continued rejection near $0.24 combined with declining volume could pressure the price lower.
A breakdown below the demand zone would likely weaken market confidence and increase downside risk.
Conclusion
OPEN currently sits at a crucial technical level where both buyers and sellers are competing for control. Strong support near $0.14–$0.16, rising Open Interest, and improving participation provide reasons for cautious optimism. However, significant resistance remains overhead between $0.24 and $0.29. The next major move will likely depend on whether buyers can convert current support into sustained upward momentum. Traders should closely monitor volume, Open Interest, and price reactions around key support and resistance levels before making trading decisions.