I’ve been staring at OPEN’s chart for the past hour, and the message is hard to ignore. The token dropped a sharp 1.9% in 24 hours, slipping from a high near $0.882 all the way down to hover around $0.850. That might not sound like a catastrophe in crypto terms, but the way it happened — and the signals that preceded it — told a classic story of an overheated asset taking a necessary breather. I want to walk you through what I saw, why I’m not panicking about the AI infrastructure thesis behind this project, and the specific level where I’d feel comfortable putting capital back to work.
When I checked the daily chart two days ago, my eyes went straight to the Relative Strength Index. It had climbed to 78, which is well above the threshold where I start paying close attention. By itself, an overbought RSI isn’t a death sentence — strong trends can stay overbought for weeks — but what truly caught my attention was the bearish divergence that formed right at the peak. Price pushed to a marginally higher high just under $0.882, yet the RSI couldn’t follow, printing a lower high instead. To me, that’s the market whispering that buyers were losing conviction even as the tag price inched higher. I’ve learned to trust that kind of momentum leak over many cycles.
Volume added another layer of confirmation. The attempted breakout above $0.88 happened on relatively thin participation, and the candle that reversed everything came with roughly 2.3 times the twenty-day average volume. That’s not retail traders taking a little profit; that’s serious size rotating out of strength, likely distributing into the liquidity that breakout chasers provided. The level that rejected price decisively was $0.90, which aligns neatly with a psychological round number and the 1.618 Fibonacci extension of the prior swing. Once that ceiling held, the sell stops resting beneath $0.865 got triggered, and the move accelerated down to the $0.845 area before a small bounce.
Now, here’s where I separate the chart from the narrative. OPEN isn’t some vaporware meme — it sits at the center of decentralized AI infrastructure, working to give broader access to large language models, GPU compute, and essential tooling. I’ve been tracking its partnership announcements, the steady uptick in mainnet activity, and the growing institutional chatter around the AI-crypto intersection. That story hasn’t changed. In fact, as capital continues to rotate away from purely speculative plays into tokens with actual utility, I suspect OPEN’s fundamentals might attract a wave of fresh demand later this year. So when I see a 10–15% correction like this, my instinct is not to run — it’s to prepare a shopping list, but with strict conditions.
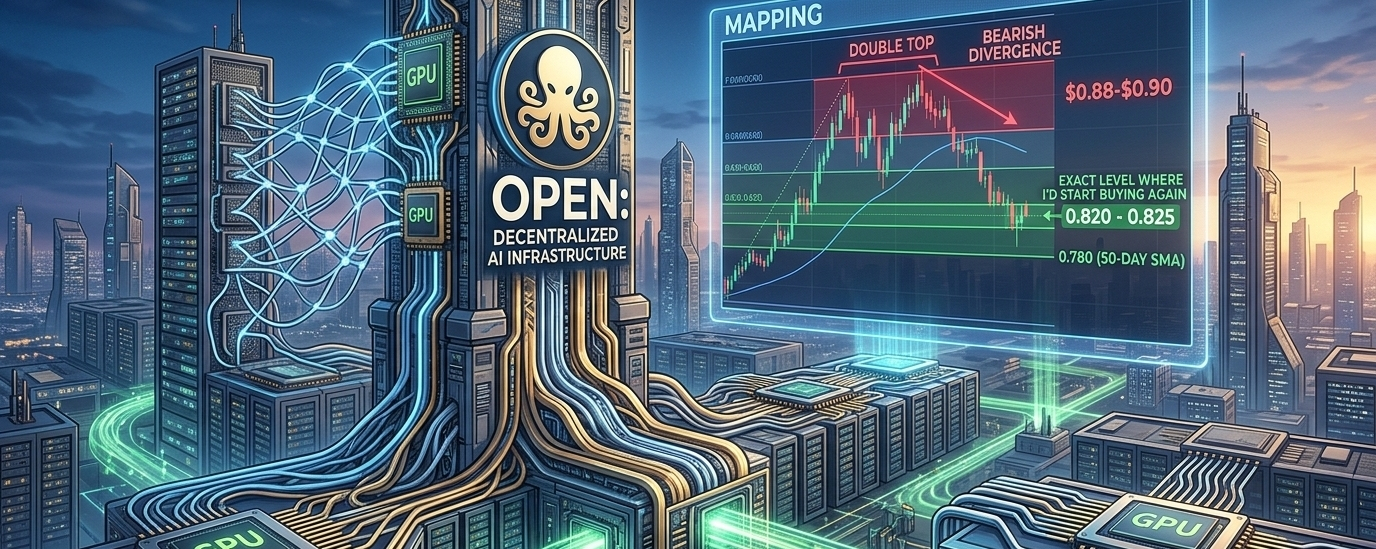
The two-day structure is where I’m anchoring my plan. We’ve got a clean double top around $0.88–$0.90, confirmed by a bearish engulfing candle that closed below the 20-day exponential moving average near $0.868. The RSI has cooled to 62, which means we’re not yet at oversold extremes — there could still be some downside left to flush out the late longs. The stochastic RSI is crossing lower as well, so I’m braced for a bit more chop. I see clear support at $0.820–$0.825, a former consolidation ceiling that should now act as a demand floor. Below that, the 50-day simple moving average sits around $0.780, aligning with a swing low from early May. That’s the line in the sand for the broader uptrend. On the upside, the broken 20-day EMA at $0.865–$0.868 has likely flipped into resistance, and only a daily close above $0.90 would make me abandon the corrective thesis.
Given all this, I’m not in a rush to catch the falling knife. My approach is simple: I’ll wait for a high-probability re-entry signal near that $0.820–$0.825 zone. I want to see a bullish reversal candle on the four-hour timeframe — something like a hammer, a morning star pattern, or a decisive engulfing green candle — and I’d like the RSI to reset into the 40–45 range, showing that the short-term momentum has truly washed out. If price stretches all the way to the 50-day SMA around $0.780 and holds, that would offer an even more attractive risk-to-reward setup in my eyes. I’d place a stop loss somewhere below $0.760, a level that would signal the trend structure is breaking, and I’d target a move back to $0.87 first, then the $0.90 rejection zone. A swing toward $0.95–$1.00 becomes viable again if the next AI narrative wave picks up steam.
For anyone already holding from higher prices, I wouldn’t view this as a crisis. What I’m considering for my own strategy is a staggered dollar-cost averaging approach — placing a few bids at $0.82 and then scaling in more if we test $0.78. That way, I’m not trying to nail the exact bottom, just building a position at levels where the structure suggests demand might reappear. The key, in my experience, is resisting the temptation to jump in on the first green wick. Let the market show its hand first.
Ultimately, I see this pullback as a healthy reset within a still-intact uptrend. The AI infrastructure story is alive and evolving, but price can only run so far before it needs to catch its breath. Patience right now isn’t passive — it’s an active part of my process.