#Learn2earn #DYOR #CryptoAnalysis
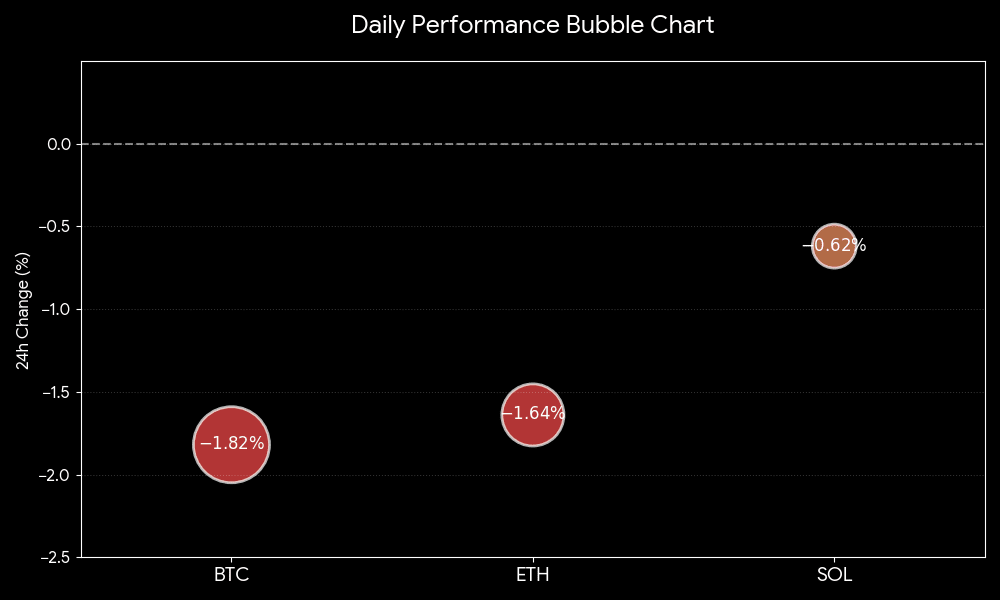
Structura actuală a pieței este vizualizată prin graficul de performanță zilnică, evidențiind volatilitatea relativă între primele trei active. Bitcoin conduce declinul cu o scădere de 1.82%, urmat îndeaproape de Ethereum cu 1.64%. Solana continuă să arate o forță relativă mai mare comparativ cu liderii pieței,Structura actuală a pieței este vizualizată prin graficul de performanță zilnică, evidențiind volatilitatea relativă între primele trei active. Bitcoin conduce declinul cu o scădere de 1.82%, urmat îndeaproape de Ethereum cu 1.64%. Solana continuă să arate o forță relativă mai mare comparativ cu liderii pieței, experimentând o retragere mai moderată de 0.62%
Această reprezentare vizuală subliniază poziționarea defensivă a pieței pe măsură ce se apropie de weekendul final al anului. Investitorii prioritizează în prezent lichiditatea, cu activele de mare capitalizare având cea mai semnificativă presiune.


Acest conținut este exclusiv pentru scopuri educaționale și nu pentru promovare.
#KashCryptoWave nu face nicio promovare, ci informează oamenii despre NUMAI BINNACE