$ZBT /USDT Price Outlook: Pump Continuation or Incoming Dump?
$ZBT has just delivered an aggressive upside move, gaining more than 70% in a short time, driven by a clear impulse breakout from a long accumulation zone. On the chart, price exploded from the 0.10 support area and pushed straight into the 0.19–0.20 resistance band with strong bullish candles and expanding volume. This type of move usually signals momentum entry by smart money, not random retail noise.
Current Market Structure
From a technical perspective, ZBT is still bullish, but now it has entered a decision zone. Vertical price moves like this rarely continue endlessly without a pause. What matters now is how price behaves near resistance, not how fast it pumped.
Bullish sign: Price is holding above prior breakout levels instead of instantly collapsing.
Caution sign: RSI is likely overextended on lower timeframes, meaning short-term profit-taking is expected.
Two High-Probability Scenarios
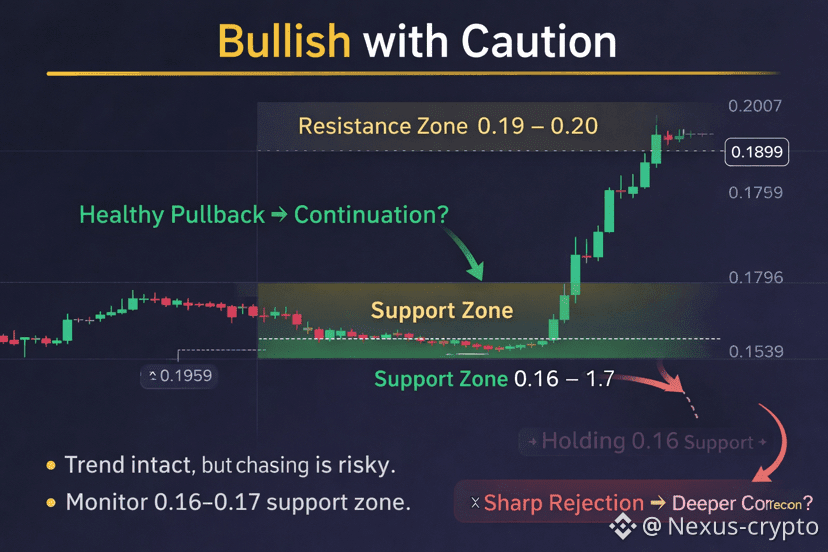
Scenario 1: Healthy Pullback → Continuation (More Likely)
If ZBT pulls back slowly toward the 0.16–0.17 zone and holds that area with low selling volume, it confirms strength. In this case, the pullback is not a dump — it’s a reset, and price can attempt another push toward 0.21–0.23.
Scenario 2: Sharp Rejection → Deeper Correction
If price loses 0.158 support with strong red volume, it indicates that late buyers are exiting. This would open a retracement toward 0.135–0.14, which is still a normal correction after a parabolic move — not a trend reversal.
Final Trader’s Verdict
$ZBT is not in a dump phase yet. The trend remains bullish, but chasing at the top is risky. Smart traders wait for confirmation: either a clean pullback and bounce, or consolidation above support. Immediate upside without rest is statistically unlikely.
This is a momentum asset, and momentum rewards patience more than emotion.
Trade the structure — not the excitement.