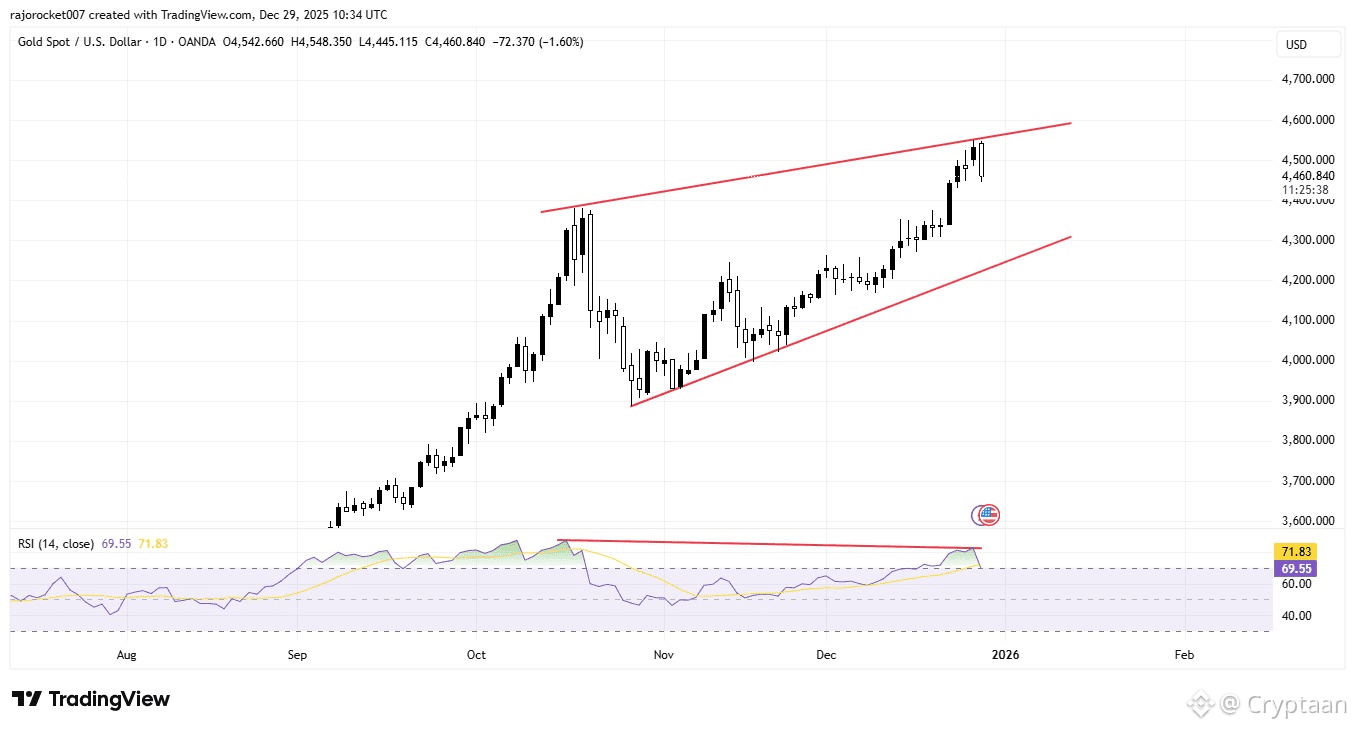
Gold is currently trading near the upper boundary of a developing rising structure on the daily chart. This structure is not yet fully confirmed, but price is reacting from a potential resistance zone while momentum is weakening.
Price is attempting to extend higher, however RSI (14) is forming a lower high — creating a bearish divergence. This does not necessarily signal a major trend reversal, but it does warn of possible exhaustion and a corrective phase.
Important context:
The current daily candle still has around 12 hours until close.
We are in the Christmas / year-end holiday period with thin liquidity, which increases the probability of sharp moves and profit-taking reactions.
Personal bias / expectation:
I do not expect a deep bearish reversal at this stage. My primary expectation is a phase of profit-taking and a controlled pullback rather than a full trend change.
Possible corrective objectives:
• Return to the previous ATH zone.
• Mean reversion into the mid of the developing structure / prior consolidation base.
Confirmation trigger:
A bearish displacement candle breaking below the most recent higher low would be the first sign that profit-taking is expanding.
Invalidation:
Strong daily acceptance above the current highs with improving RSI structure would delay or cancel the corrective scenario.
👉 This is a technical perspective based on structure and momentum, not financial advice.