Every December, crypto finds a way to mix dreams with charts.
In 2025, that dream had a name — #BTC90kChristmas. The idea was simple, almost cinematic: Bitcoin would gift-wrap a $90,000 breakout just in time for the holidays. Traders joked. Influencers hyped. Memes rolled across timelines like snow.

But markets don’t celebrate holidays. They test conviction — and this one turned into a lesson far bigger than a missed target.
Where the Hype Began and Why It Felt So Believable
The hashtag started as a meme — and quickly became a movement.
Analysts pointed to institutional inflows, ETF momentum, and the lingering impact of the April halving. People shared countdown graphics, bold predictions, and confident threads about “Santa rallies.”
And honestly — there was logic behind it:
• Institutional demand was surging earlier in the year.
• Halving psychology supported supply-shock narratives.
• Sentiment on X blended humor, conviction, and hope.
The problem wasn’t optimism.
It was forgetting how unforgiving timing can be.
Christmas Arrived — The Breakout Didn’t
By December 25, reality showed up cold.
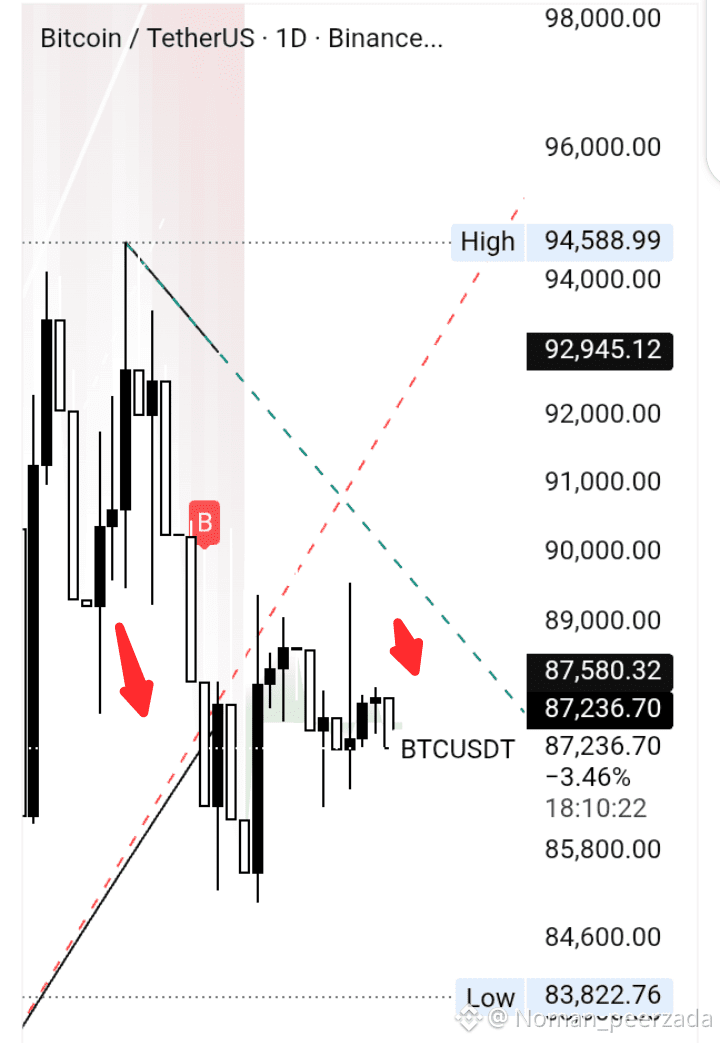
Bitcoin hovered between $86K–$89K, repeatedly tapping resistance and slipping back. The breakout narrative thinned, replaced by sideways chop and year-end profit-taking.
It wasn’t a crash.
It was something more frustrating: a rally that stalled inches from the finish line.
Some laughed it off. Others held quietly. Pros simply waited.
Technical Snapshot — What the Charts Actually Showed
This is where sentiment met structure.
Key Support & Resistance (Daily Chart)
• Major support:
o $84,500–$86,000 → buyers consistently defended this area
o $79,000–$80,000 → deeper demand pocket if fear accelerates
• Immediate resistance:
o $89,500–$90,500 → repeated rejections
o $94,000+ → breakout confirmation zone
Translation: Bitcoin wasn’t weak — it was stuck inside a heavy ceiling.
Momentum Indicators
• RSI (Daily): drifting neutral → neither oversold nor explosive
• RSI (4H): frequent spikes, then cool-offs — textbook range trading
• MACD: flattening — signaling indecision, not trend reversal
Momentum didn’t vanish.
It just went into “wait mode.”
Moving Averages
• Price hovered above the 100-day MA — long-term structure intact
• Danced around the 20- and 50-day MAs — classic consolidation
• Never lost its higher-low pattern — a quiet bullish tell
In other words: cooling — not collapsing.
Liquidity & Whales
Order book heatmaps showed something subtle:
• liquidity stacked above $90K → trap shorts & fade breakouts
• accumulation footprints below $86K → silent buy zones
Whales weren’t chasing hype.
They were positioning — slowly.
The Days After — Pressure Without Panic
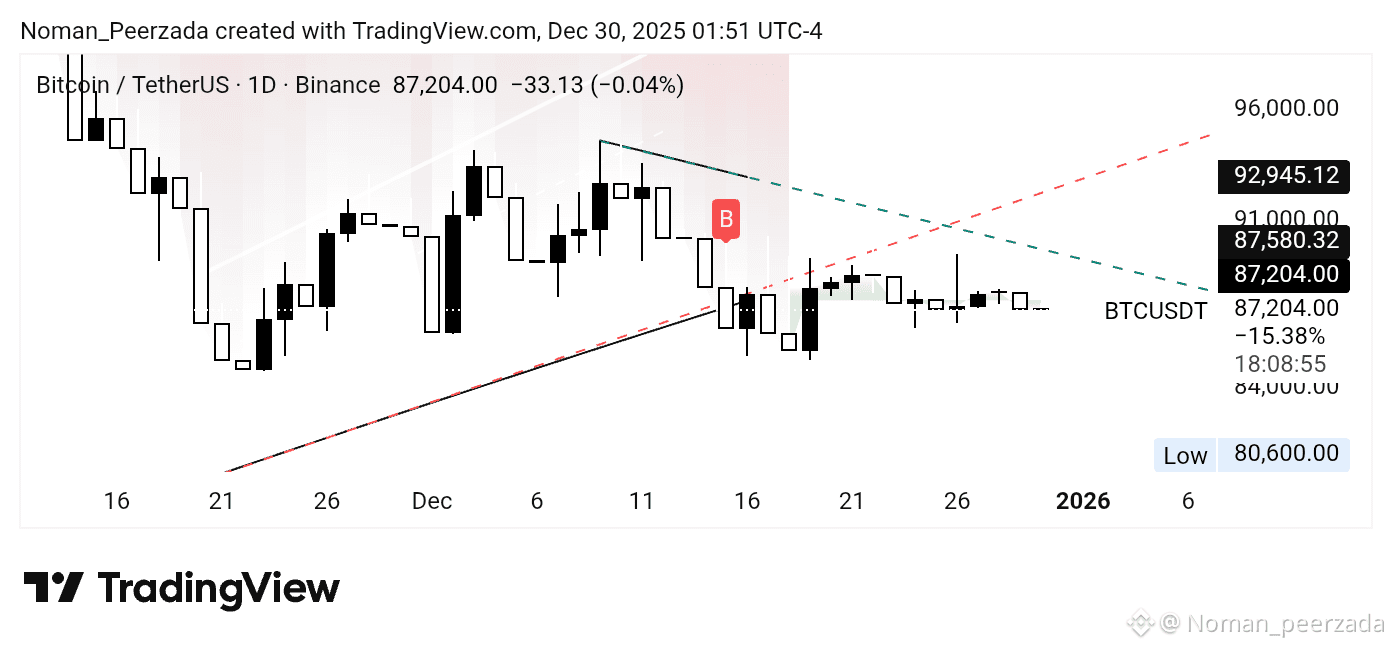
Heading toward December 30, BTC settled near $87K.
Prediction polls split. Analysts warned holiday liquidity could exaggerate any move. Gold headlines, macro whispers, ETF flows suddenly everything mattered again.
Nothing dramatic happened.
But the tension stayed — and tension often precedes decision.
🎯 Lessons From #BTC90kChristmas
• Memes move conversations — not markets
• Breakouts fail when liquidity isn’t ready
• Corrections in strong trends are pauses — not endings
• Patience quietly outperforms prediction
History still rhymes: discouraging Decembers often precede surprising recoveries.
So… What Comes Next?
Here’s the honest version:
If Bitcoin reclaims and holds above $90,500, momentum returns fast and the chart opens toward $94K → $98K.
If it loses $84K, patience becomes the edge and deeper discounts appear before the next leg.
Either way, the signal hasn’t changed:
Bitcoin’s real edge isn’t holiday hype — it’s resilience.
And resilience tends to reward traders who stay grounded while everyone else chases hashtags.