
🪙 Bitcoin Dominance trades below resistance
#BitcoinDominance #BTCDOM #BTCDOMUSDT
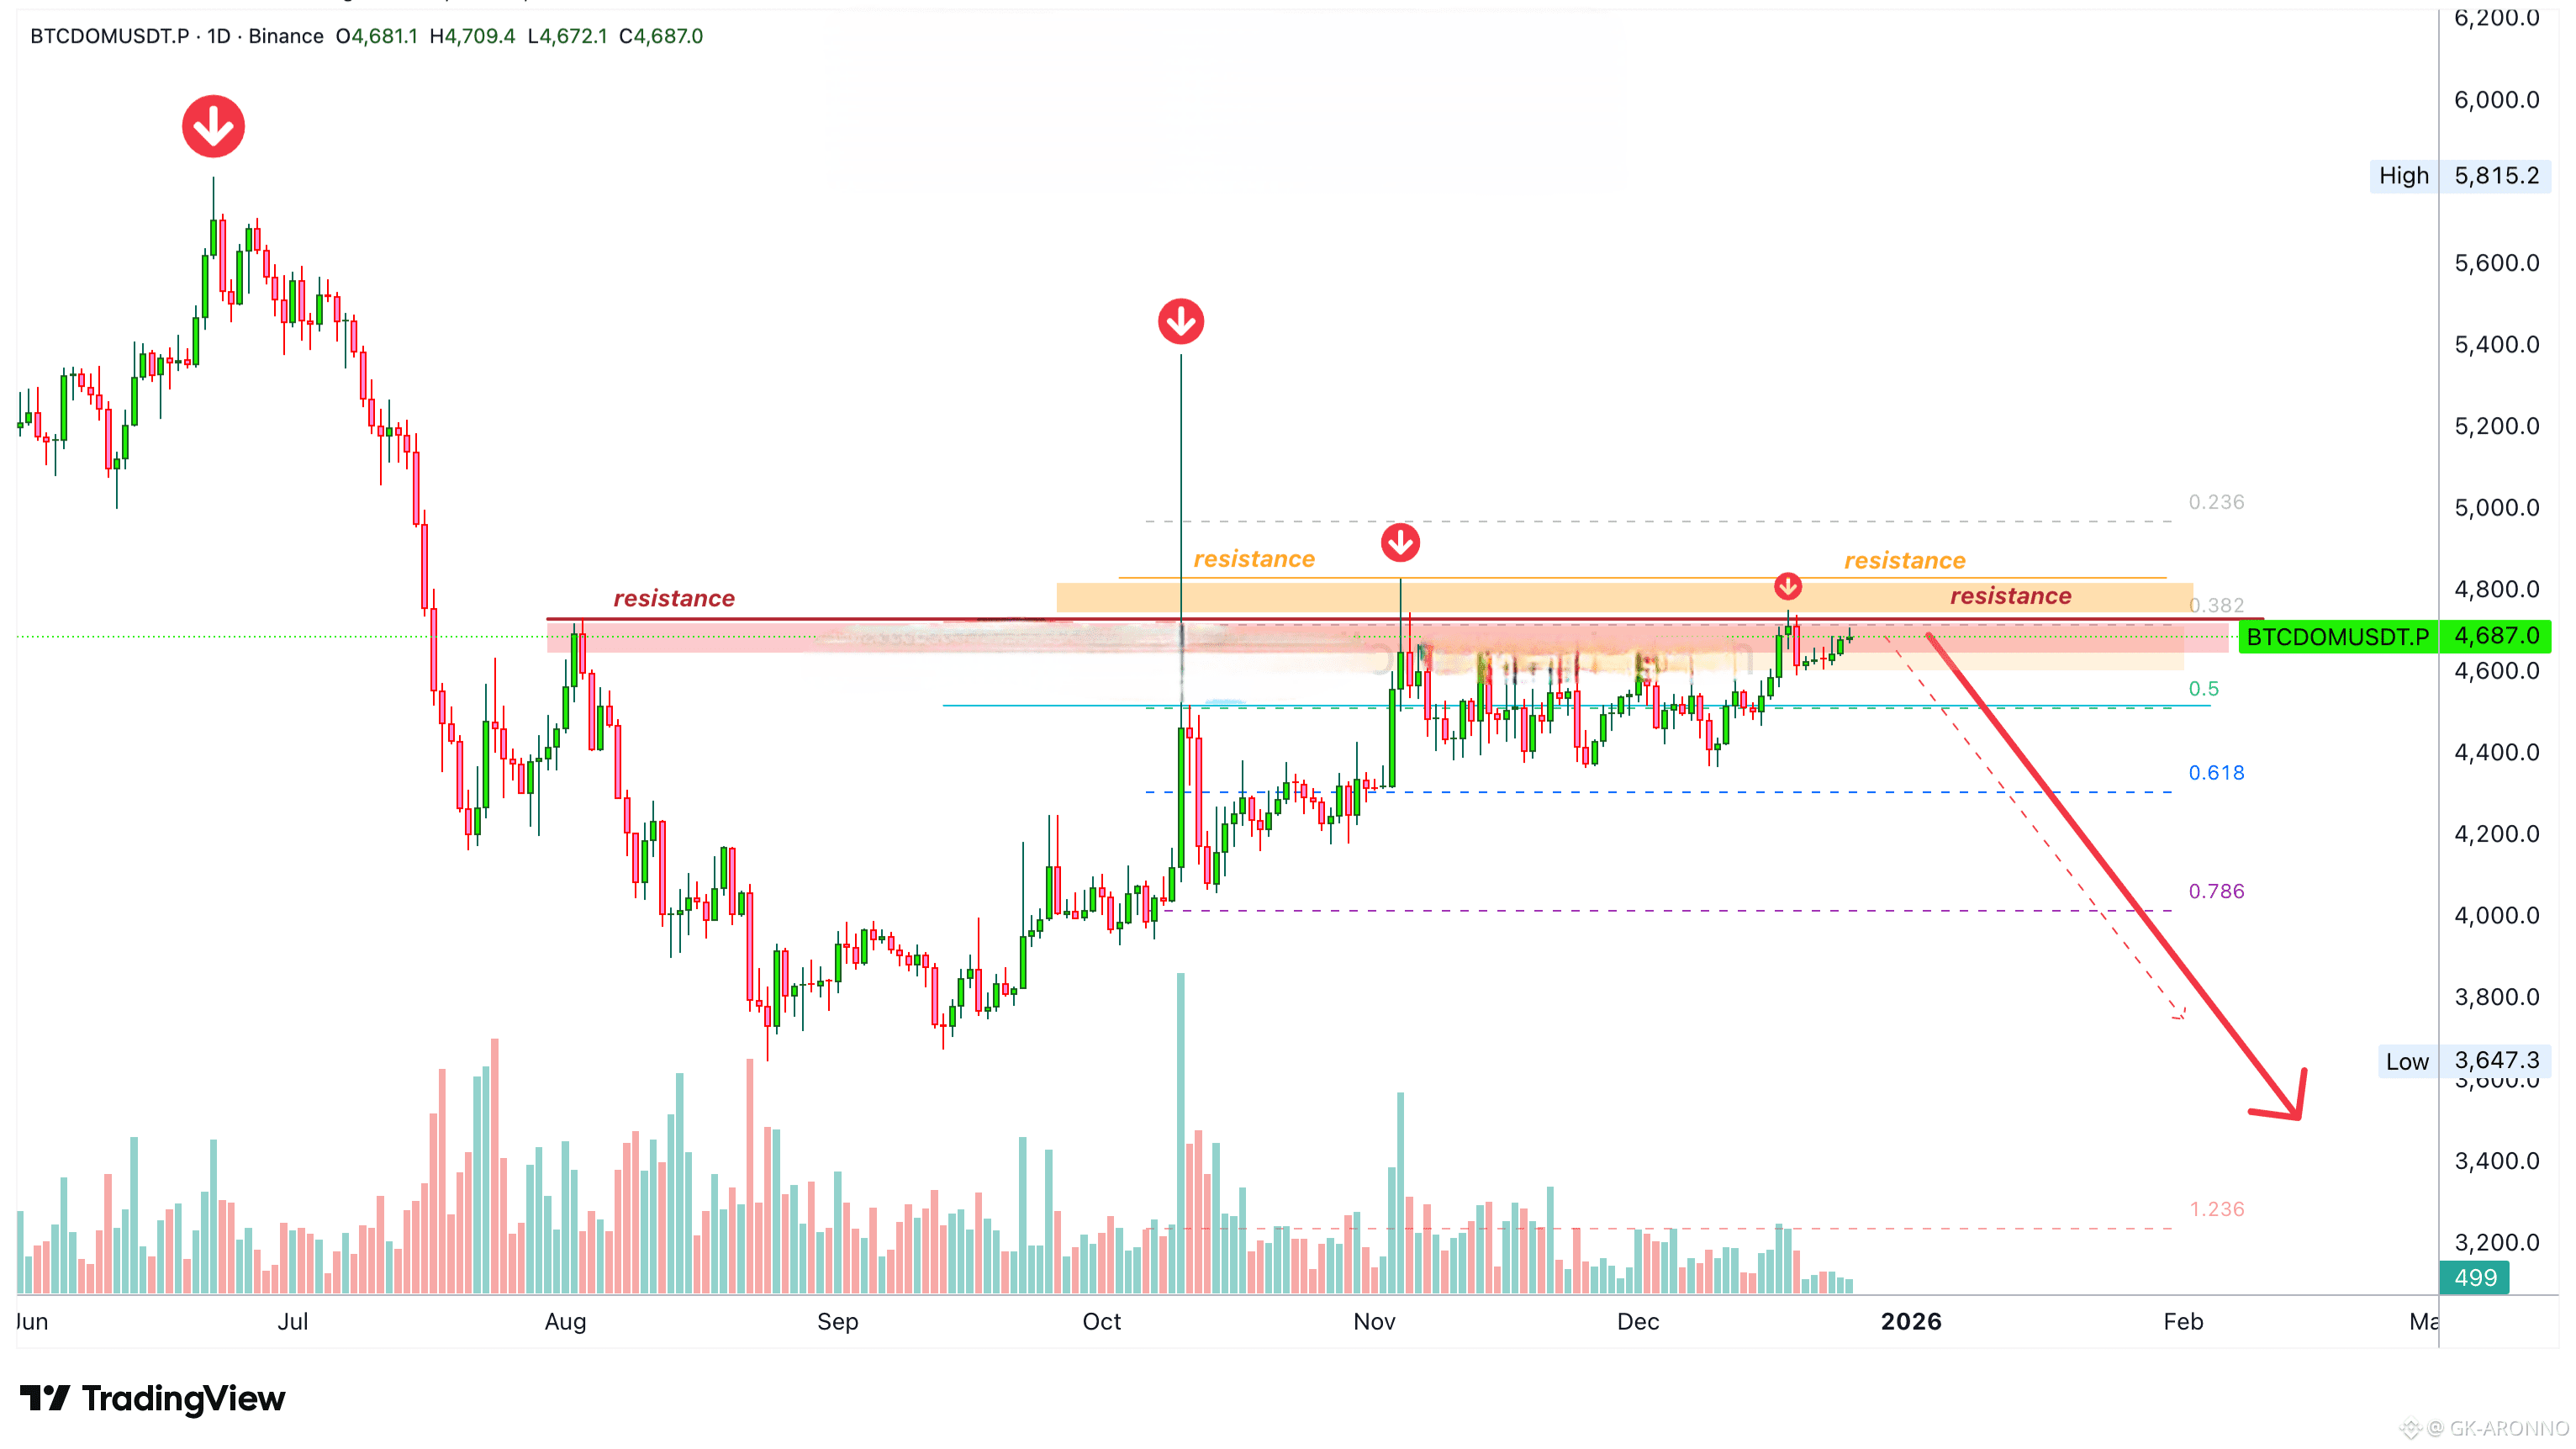
With each passing day, trading volume continues to decrease. Before a major move volume dries out. Two major resistance levels on this chart can be coupled into a range. Between 4,700 and 4,800.
This resistance zone has been active since August 2025 and not a single session managed to close above it.
A sudden move can happen in any direction. The tendency of the chart candles is bullish, slowly rising candles yet, the potential is bearish. Slowly rising candles with decreasing volume each time ending with a lower high. Very strong lower highs in some cases.
The longer the consolidation period, the stronger the move that follows.
While the next move can happen in any direction, the chart is telling us the bears have the upper-hand.
Bitcoin Dominance (BTCDOM) continues bearish after months of sideways. This index chart continues to support a bullish altcoins market in the coming days, weeks and months.
Namaste.


