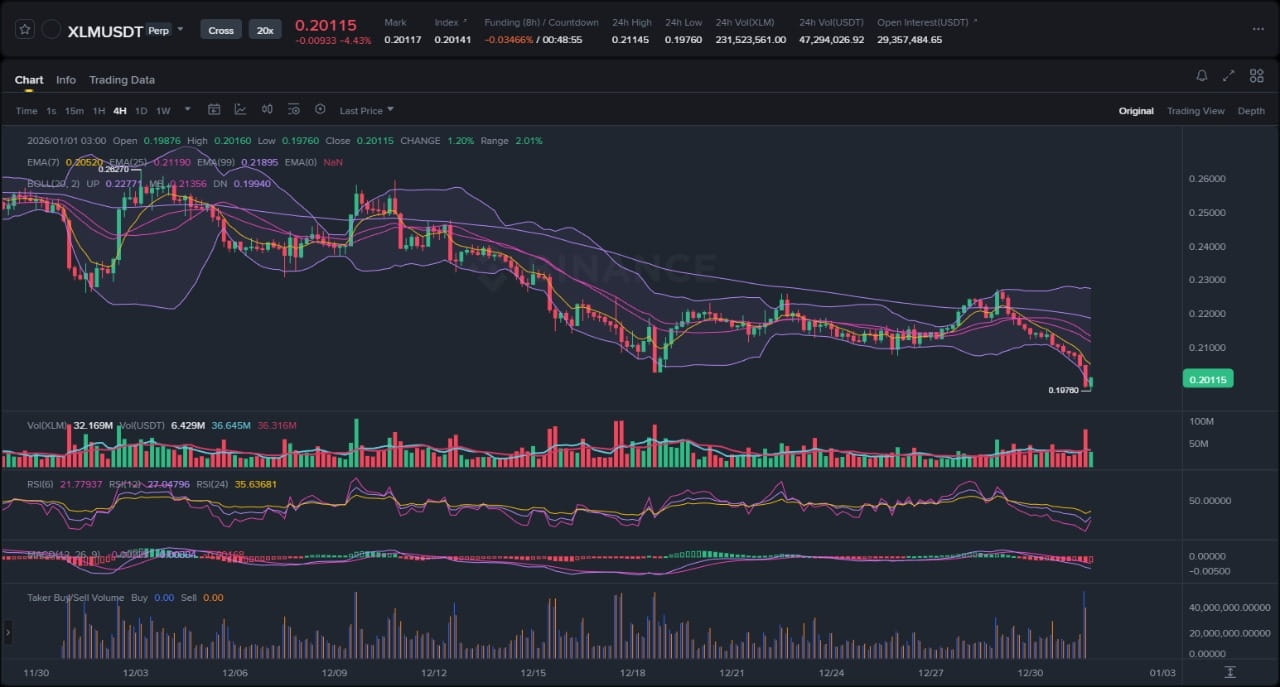
After a prolonged period of consolidation, Stellar (XLM) has experienced a significant volatility expansion to the downside. The recent price action has resolved a multi-week balance area with a decisive move, breaking below a critical support structure that had contained selling pressure throughout the latter half of December. This development shifts the market structure from range-bound to a potential bearish trend continuation, demanding close observation from market participants for signs of follow-through or invalidation.
Market Snapshot:
The XLMUSDT perpetual contract is currently exhibiting clear bearish characteristics on the 4-hour timeframe. The market has transitioned from a low-volatility compression phase, evident by the tightening of the Bollinger Bands, into a distribution phase marked by a sharp, impulsive sell-off. This move has established a new local low, breaking the preceding market structure and suggesting that sellers are currently in control of the order flow. The increase in trading volume accompanying this downward move lends credibility to the breakdown, indicating a degree of market consensus behind the new direction.
Chart Read:
A technical examination of the 4-hour chart reveals several key elements. First, the price has clearly broken down from a well-defined consolidation range that was established throughout mid-to-late December. This range acted as an accumulation or distribution zone, and the exit direction suggests the latter. Second, the breakdown was accompanied by a significant volatility expansion, with the price piercing through the lower Bollinger Band on a high-volume candle. This is often characteristic of the beginning of a new directional leg. Third, momentum oscillators such as the Relative Strength Index (RSI) have plunged into oversold territory, signaling the strength of the recent sell-off. While oversold conditions can sometimes precede a bounce, in a strong trend, they can persist. The prevailing bias is therefore bearish, predicated on the structural break of support on increasing volume.
News Drivers:
From a fundamental perspective, the current market action appears to be driven purely by technical factors and broader market sentiment. A review of recent catalysts indicates a news vacuum for the Stellar project. There have been no significant project-specific announcements, partnership news, or regulatory updates to drive a narrative in either direction. This lack of fundamental drivers can be categorized as a Neutral-to-Bearish theme. In the absence of positive catalysts to create demand, assets become more susceptible to technical selling pressure and negative macro-economic crosswinds. The bearish price action is therefore developing without any clear fundamental opposition.
Scenario A: Bearish Continuation
The primary scenario, given the technical evidence, is a continuation of the bearish momentum. For this to unfold, we would expect to see the previous range low act as new resistance. The price may attempt a mean reversion back towards this broken support level. A failure to reclaim this level, confirmed by a rejection on significant sell-side volume, would validate the breakdown. This would signal that market participants are now viewing the prior support as a new layer of supply, opening the potential for a measured move downward toward the next significant liquidity pockets.
Scenario B: Bearish Invalidation / Liquidity Grab
The alternative scenario is that the recent breakdown is a fakeout, designed to engineer liquidity by tripping stop-loss orders below the range. For this scenario to gain credibility, the price would need to stage a swift and aggressive recovery back inside the previous consolidation range. A strong reclaim of the broken support level on high buy-side volume would invalidate the bearish thesis. This action would trap sellers who entered on the breakdown, potentially fueling a short squeeze that could drive the price back toward the upper boundary of the prior range.
What to Watch Next:
1. Reaction at the Breakdown Level: Closely monitor the price action if it retests the former support zone. A weak, low-volume rally followed by a sharp rejection would favor the bearish continuation scenario.
2. Volume Confirmation: Observe trading volume on subsequent price movements. Continued high sell volume on down moves would confirm bearish control, whereas a surge in buy volume on an attempt to reclaim the range would support the invalidation scenario.
3. Momentum Divergence: Watch the RSI for any signs of bullish divergence. If the price forges a new low but the RSI prints a higher low, it could indicate that downside momentum is waning, providing an early warning for a potential reversal.
Risk Note:
This content is for informational purposes only and does not constitute financial or investment advice. The cryptocurrency market is subject to high volatility and risk.
The current price action represents a critical juncture for XLM.