Bitcoin (BTC/USDT) Short-Term Price Action — Market Insight
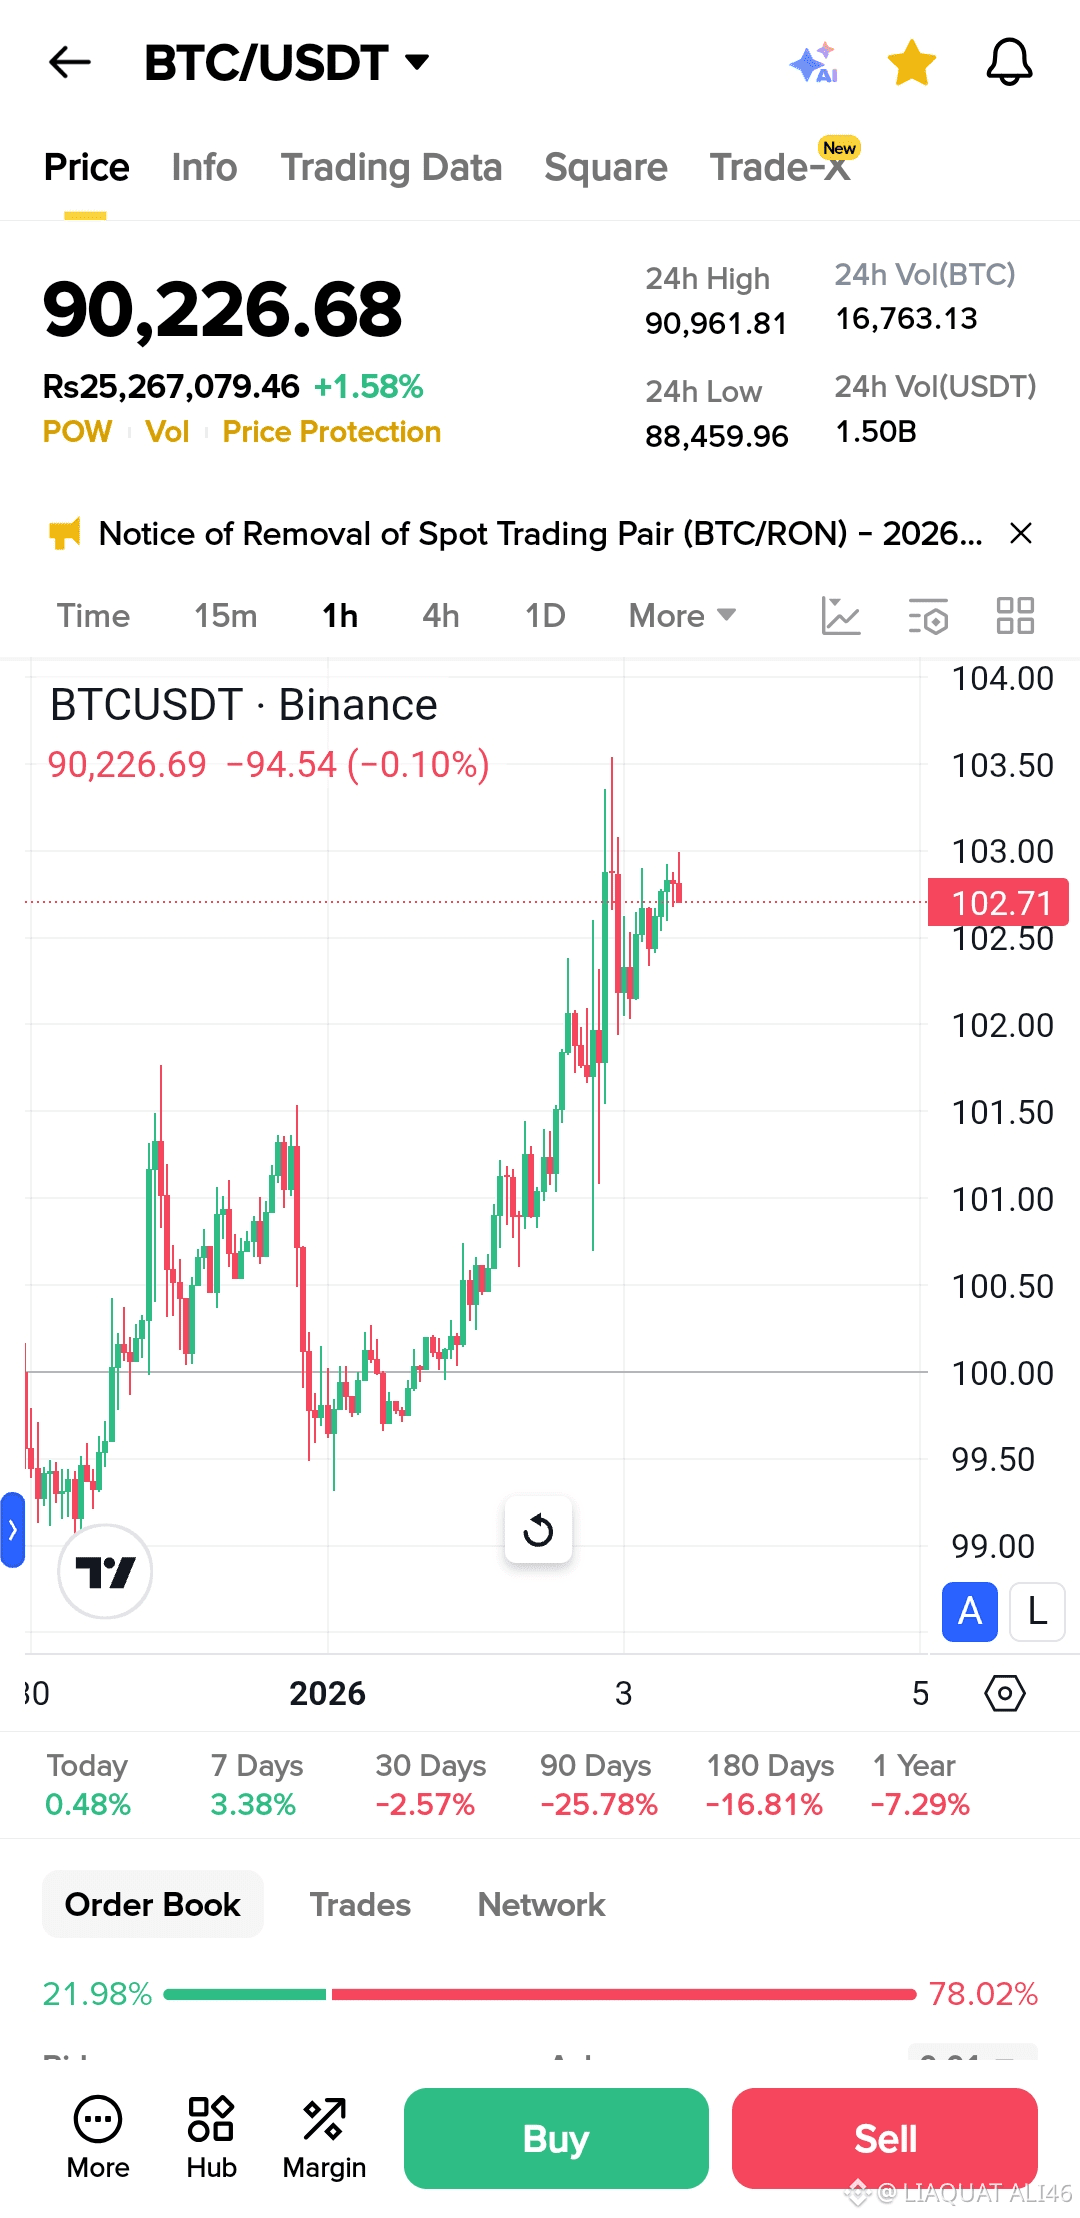
The BTC/USDT chart shown on the 1-hour (1H) timeframe highlights a clear short-term bullish recovery after a recent period of consolidation. Bitcoin is currently trading around $90,226, showing a modest daily gain and signaling renewed buying interest in the market.
Price action indicates a series of higher highs and higher lows, which is a classic sign of short-term bullish momentum. After finding support near the psychological $99,500–$100,000 zone, Bitcoin rebounded strongly, pushing upward with increased volatility. The sharp bullish candles suggest aggressive participation from buyers, although some upper wicks indicate selling pressure near local resistance.
The 24-hour high of $90,961 and low of $88,459 show an expanded trading range, confirming active market engagement. However, the order book data reveals approximately 78% sell pressure versus 22% buy pressure, which implies that despite the upward move, sellers are still dominant at higher levels. This could limit further upside in the very short term unless volume increases on the buy side.
From a technical standpoint, the area around $102.70 (chart scale) acts as an immediate resistance zone where price is currently consolidating. A clean breakout above this level could open the door for continued upward momentum, while rejection may result in a pullback toward previous support levels.
Conclusion:
Bitcoin is showing short-term strength with bullish structure on the 1-hour chart, but strong sell-side pressure suggests caution. Traders should closely monitor resistance levels and volume behavior to confirm whether this move develops into a sustained rally or transitions into another consolidation phase.
This article is for educational purposes only and does not constitute financial or investment
 advice.#BTCANALYSIS📊 #BTCVSGOLD $BTC
  BTC91,793.42-2.52%