---$BOME
🚀 BOME/USDT – REVERSAL CONFIRMED? | DETAILED DAILY TIMEFRAME ANALYSIS 🚀
BOME is finally showing strong bullish signs after a long corrective phase. The chart is flashing early signals of a trend reversal, and momentum is clearly shifting in favor of the buyers. Let’s break everything down in detail 👇
---
📊 Market Overview
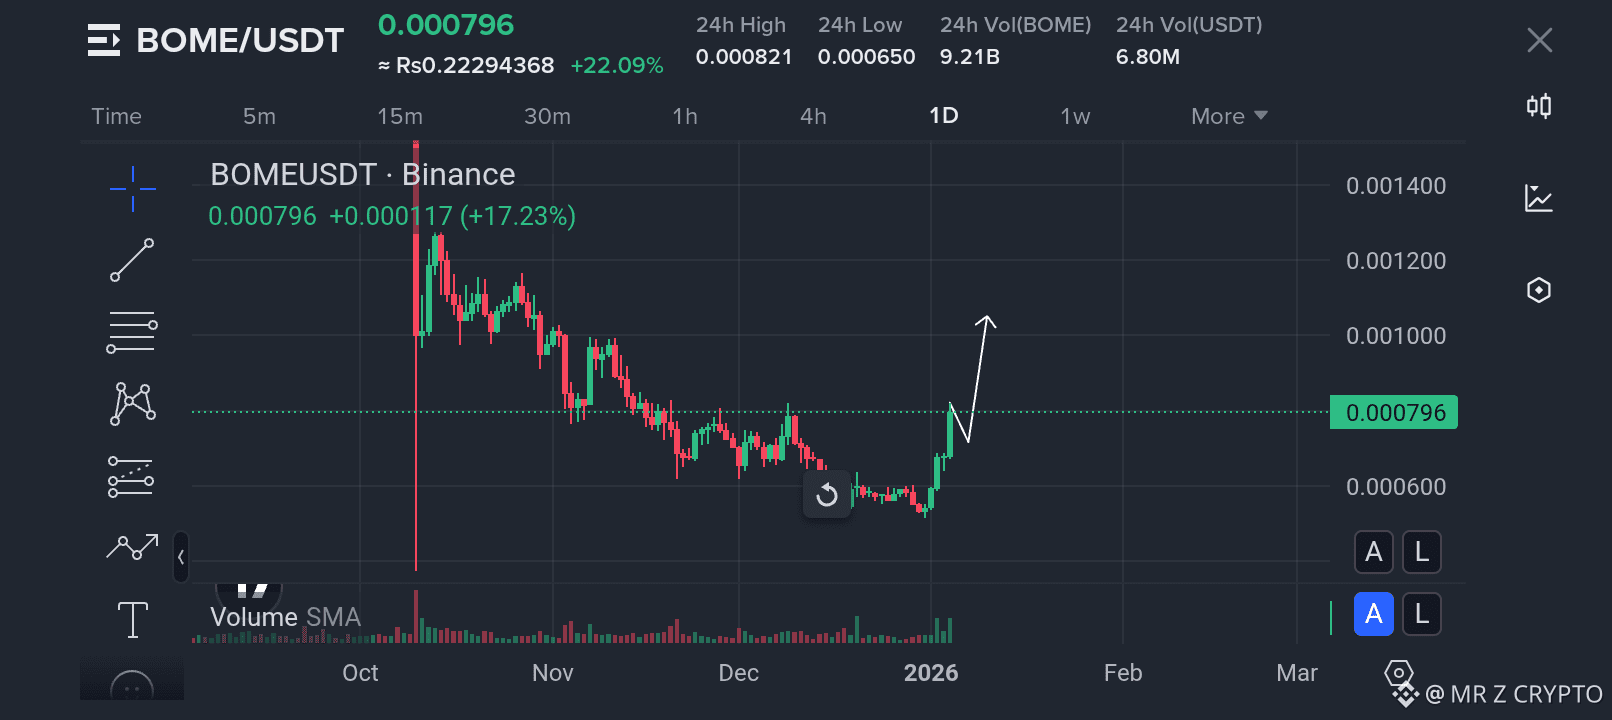
Pair: BOME/USDT (Binance)
Current Price: ~0.000796
24H Change: +22% 🔥
Timeframe: 1D (Daily)
Volume: Increasing
After months of continuous selling pressure, BOME has printed a strong impulsive green candle, signaling renewed interest and fresh capital entering the market.
---
🔍 Technical Structure Analysis
🟢 Key Demand Zone Respected
Price formed a solid base around 0.00058 – 0.00062, a strong historical demand zone.
This area acted as a launchpad for the current move.
➡️ Multiple small-bodied candles in this zone indicated accumulation before expansion.
---
📈 Trend & Momentum Shift
✅ Downtrend Broken:
The sequence of lower highs has been broken — an important early reversal signal.
✅ Higher Low Formed:
This confirms weakening bearish control and strengthening bullish momentum.
✅ Strong Breakout Candle:
The large green candle with rising volume validates the breakout above short-term resistance.
---
📊 Volume Insight
Volume spike confirms buyer dominance
Rising volume during green candles = healthy trend
No signs of distribution yet
📌 Volume supports price action — this is a positive sign.
---
🎯 Important Price Levels
🟩 Support Levels
0.00062 – 0.00065 → Major demand zone
0.00070 → New short-term support
🟥 Resistance & Targets
🎯 0.00090 → First resistance
🎯 0.00100 → Psychological level
🎯 0.00120 → Previous high zone
🎯 0.00140+ → If momentum accelerates 🚀
A daily close above 0.00080 would strongly confirm bullish continuation.
---
🔄 Possible Scenarios
🟢 Bullish Continuation
Minor pullback to 0.00072–0.00075
Strong continuation toward 0.00090 → 0.00100
🟡 Consolidation
Sideways movement between 0.00070 – 0.00080
Market builds energy for next leg
🔴 Invalidation
Breakdown below 0.00058
Demand zone failure = bearish continuation
---
⚠️ Risk Management
Meme coins are highly volatile
Avoid FOMO buying at resistance
Scale entries and take partial profits
Always use stop-loss
---
🧠 Final Thoughts
BOME is showing classic bottom-formation behavior with strong confirmation from price structure and volume. If the market sentiment remains supportive, this could be the start of a larger recovery move rather than just a short-term bounce.
📌 This is NOT financial advice. Always do your own research (DYOR).
🔥 Like | Share | Follow for More High-Quality Crypto Analysis
💬 Comment your BOME target below 👇
---