---$FET
🚀 FET/USDT – FULL DETAILED BREAKDOWN | MASSIVE MOVE INCOMING? (1D TIMEFRAME) 🚀
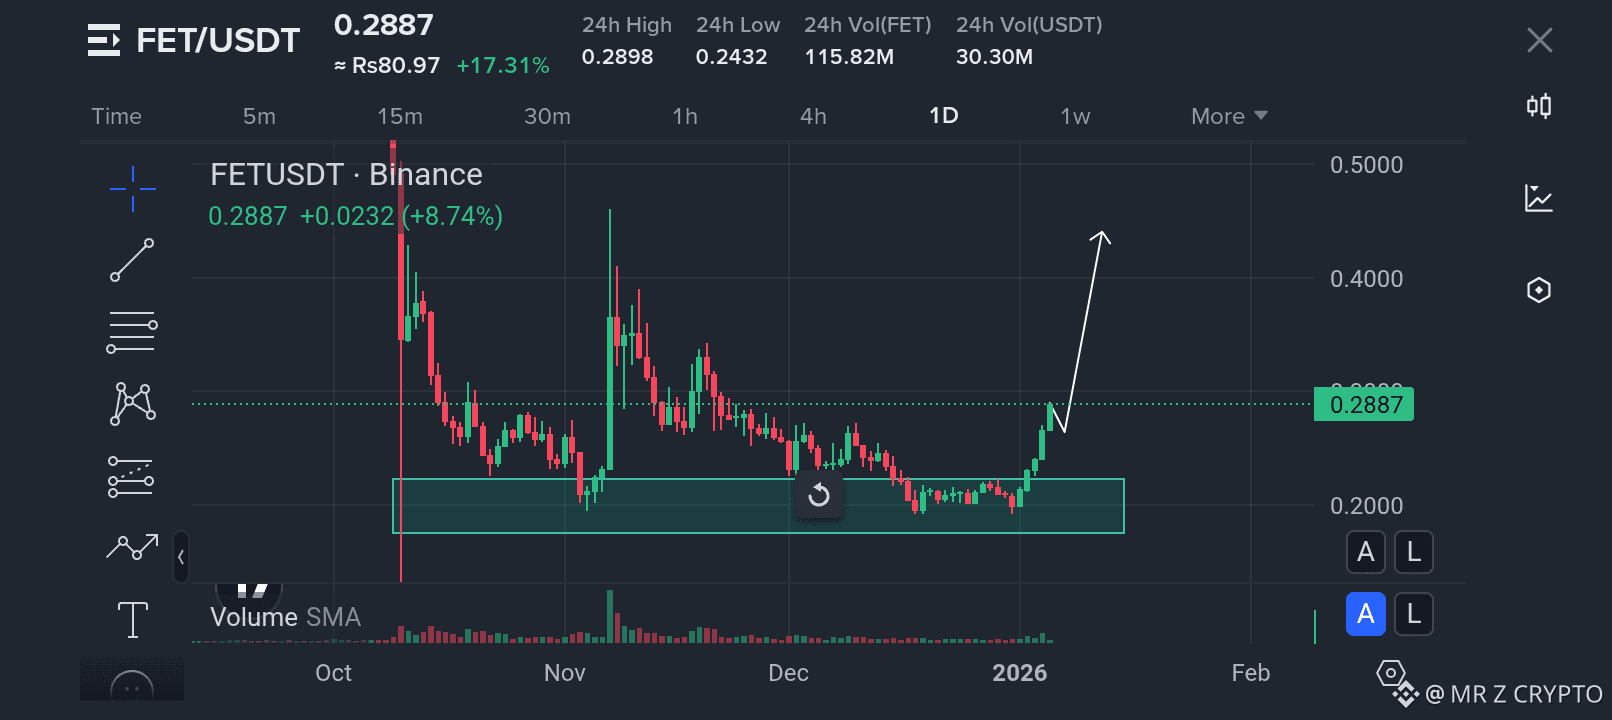
This is a high-timeframe analysis of FET/USDT, and it clearly shows why this zone is extremely important for mid-term and even long-term traders. Read carefully 👇
---
📌 MARKET OVERVIEW
FET (Fetch.ai) has been under heavy correction for several months. After completing a strong distribution phase near the top, price entered a long bearish structure. However, smart money does not buy tops — they buy fear, boredom, and silence. That is exactly what we are seeing now.
The price has spent a long time inside a strong accumulation range, forming a solid base. This phase usually comes before a powerful expansion move.
Current Price: $0.288
Timeframe: Daily (1D)
---
🟩 STRONG DEMAND & ACCUMULATION ZONE
The highlighted green box between $0.20 – $0.23 is not random.
✔ This zone has been tested multiple times
✔ Long wicks show aggressive buying pressure
✔ Price refused to break below despite market weakness
✔ Classic accumulation behavior
Every time price entered this region, buyers stepped in strongly, absorbing all sell pressure. This tells us that large players are defending this level.
---
📈 MARKET STRUCTURE SHIFT (VERY IMPORTANT)
For the first time in a long period:
🔹 Downtrend has slowed
🔹 Lower lows are no longer being created
🔹 A higher low is now visible
🔹 Bullish candle closed above previous resistance
This indicates a structure shift from bearish to bullish on the daily timeframe — something that should never be ignored.
---
📊 VOLUME CONFIRMATION
Volume is increasing during bullish candles and decreasing during pullbacks.
This confirms:
✔ Buyers are in control
✔ This move is not weak or random
✔ Breakout is supported by real demand
No strong move survives without volume — and here, volume is clearly supporting the bulls.
---
🎯 TARGETS (STEP-BY-STEP)
If price continues to hold above the breakout zone:
🎯 Target 1: $0.34 – $0.36
(Previous resistance + liquidity zone)
🎯 Target 2: $0.40 – $0.42
(Psychological + structure resistance)
🎯 Target 3: $0.48 – $0.50
(Major supply zone / swing high)
📌 If momentum and market sentiment stay strong, $0.50+ is very possible in the coming weeks.
---
⛔ INVALIDATION / RISK ZONE
No analysis is complete without risk management.
❌ Daily close below $0.23
❌ Strong rejection with high selling volume
If this happens, the bullish scenario weakens and patience is required.
---
🤖 FUNDAMENTAL EDGE (AI NARRATIVE)
FET belongs to the AI + Automation sector, which is one of the strongest narratives in crypto.
When AI coins move, they move FAST and HARD.
Once momentum starts, retail chases — and that’s where exponential candles appear.
---
🧠 TRADER PSYCHOLOGY
Most traders:
❌ Buy green candles at the top
❌ Sell during accumulation at the bottom
Smart traders:
✔ Accumulate near strong support
✔ Enter when structure flips
✔ Hold while others doubt
Right now, FET is in the early belief stage.
---
🔥 FINAL THOUGHTS
FET is showing:
✅ Strong accumulation
✅ Confirmed support
✅ Structure shift
✅ Volume confirmation
✅ Bullish continuation potential
This setup is high-probability if the overall market stays stable.
---
⚠️ DISCLAIMER
This is NOT financial advice. Crypto is highly volatile.
Always use stop-loss, manage risk, and do your own research (DYOR).
💬 What do you think?
Is FET ready for a big move or still range-bound?
👍 Like | 🔁 Share | 📌 Follow for more deep technical analysis
🚀 Let the chart speak!
---