---$RENDER
🚀🔥 RENDER/USDT – DEEP DIVE ANALYSIS | SMART MONEY MOVE JUST STARTED? (1D TIMEFRAME) 🔥🚀
This is a high-timeframe, long-form breakdown of RENDER (RNDR) that every serious trader and investor should read carefully. The chart is quietly telling a story — and those who listen early are usually rewarded the most.
---
📌 MARKET CONTEXT
RENDER experienced a strong bullish run earlier, followed by a sharp corrective phase. That correction wasn’t random — it was necessary. Markets move in cycles:
➡️ Expansion → Distribution → Correction → Accumulation → Expansion again.
For months, RNDR was stuck in a painful downtrend, shaking out over-leveraged traders and emotional holders. Now that phase appears to be ending.
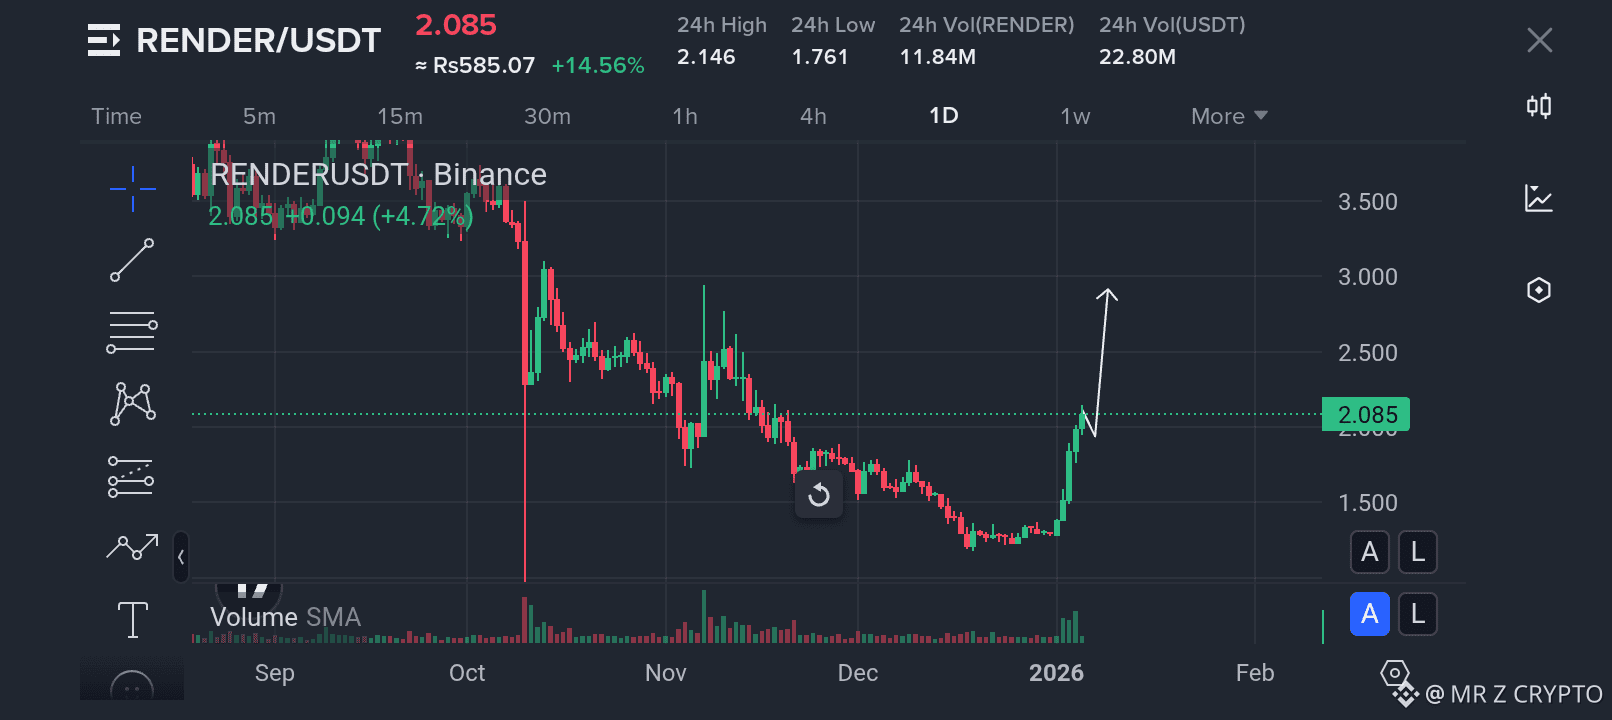
Current Price: $2.08
Timeframe: Daily (1D)
---
🟥 THE DISTRIBUTION & FLUSH PHASE
The aggressive drop earlier in the chart represents a liquidity sweep:
Stops were hunted
Weak hands were forced out
Panic selling dominated
Social sentiment turned extremely bearish
This is usually where institutions and long-term players start planning entries, not exits.
---
🟩 ACCUMULATION ZONE – THE REAL STORY
Between $1.30 – $1.45, RNDR spent a long time moving sideways.
Why this zone matters: ✔ Multiple rejections from below
✔ Long lower wicks (buyers defending price)
✔ Decreasing selling pressure
✔ Flat structure = absorption of supply
This is classic accumulation behavior. Price doesn’t explode immediately — it builds energy.
---
📈 STRUCTURE SHIFT – CONFIRMATION SIGNAL
This is the most important part of the chart.
For the first time in months: ✅ Downtrend structure has been broken
✅ A strong bullish impulse candle appeared
✅ Price reclaimed key resistance near $1.90 – $2.00
✅ Higher high & higher low formation confirmed
This marks a trend reversal on the daily timeframe — a signal that swing traders wait weeks for.
---
📊 VOLUME TELLS THE TRUTH
Price without volume is meaningless.
Here, volume confirms the move:
🔹 Breakout came with rising volume
🔹 Pullbacks had weak volume
🔹 Buyers are aggressive, sellers are passive
This behavior supports continuation, not reversal.
---
🧠 MARKET PSYCHOLOGY (VERY IMPORTANT)
Right now, the market is in the “disbelief phase”.
Most people are thinking: ❌ “It’s just a bounce”
❌ “Price will dump again”
❌ “I’ll buy lower”
But historically, this is where trends begin. By the time confidence returns, price is already much higher.
---
🎯 UPSIDE TARGETS (IF STRUCTURE HOLDS)
If RNDR continues respecting the breakout:
🎯 Target 1: $2.40 – $2.50
(First major resistance + liquidity area)
🎯 Target 2: $2.80 – $3.00
(Psychological level + previous support)
🎯 Target 3: $3.30 – $3.50
(Major supply zone / macro resistance)
🚀 In a strong AI narrative push, $4+ is not impossible in the mid-term.
---
⛔ INVALIDATION & RISK MANAGEMENT
Every bullish plan needs a clear invalidation.
❌ Daily close below $1.75
❌ Strong bearish volume rejection
If this happens, patience is required and reassessment is key.
---
🤖 FUNDAMENTAL EDGE – AI & GPU NARRATIVE
RENDER is not just another altcoin.
🔹 Decentralized GPU rendering
🔹 AI, 3D, Metaverse & compute demand
🔹 Growing real-world utility
Narratives drive markets — and AI remains one of the strongest narratives in crypto.
---
🧩 BIG PICTURE SUMMARY
RNDR is showing: ✅ Long accumulation phase
✅ Confirmed structure break
✅ Volume-backed breakout
✅ Clear upside targets
✅ Strong narrative support
This is the type of setup that often moves slowly at first… then very fast.
---
🔥 FINAL WORD
The chart suggests RNDR is transitioning from accumulation → expansion.
Early entries come with doubt. Late entries come with regret.
Trade smart. Manage risk. Let the chart do the talking.
---
⚠️ DISCLAIMER
This is NOT financial advice. Crypto markets are highly volatile. Always do your own research (DYOR) and use proper risk management.
---