A well-known crypto market analyst recently described $XRP weekly chart as “one of the best-looking charts in the market,” while sharing price targets based on his green box setup. The commentary comes from the anonymous analyst behind the Freedom by 40 account, who focuses on long-term financial freedom through technical analysis. He has repeatedly highlighted XRP as one of the strongest charts in crypto and reiterated this view during $XRP recent recovery.
After a weak Q4 2025 that saw $XRP XRP drop around 35% from $2.84 in October to $1.84 by the end of the year, the asset started 2026 with a strong rebound. XRP is up nearly 30% so far this year, outperforming Bitcoin, Ethereum, Solana, BNB, and most other top-20 cryptocurrencies.
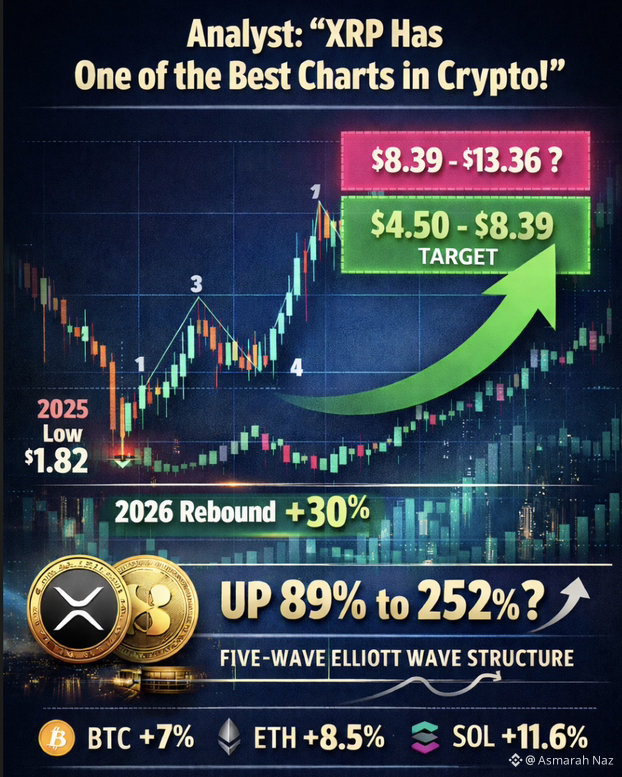
According to the analyst, XRP has been following a five-wave Elliott Wave structure on the weekly timeframe since early 2023. Wave 1 ended at $0.94 in July 2023 after the positive SEC ruling, while Wave 2 corrected to $0.38 by July 2024. Wave 3 then pushed XRP to a peak of $3.40 in January 2025 during the broader market rally. The decline that followed formed Wave 4 through an ABC correction. In October 2025, when XRP was trading near $2.55, the analyst warned that further downside was likely, a scenario that played out as XRP fell to around $1.82 in December 2025.
With XRP now recovering from that low, the analyst believes Wave 5 is underway. His chart highlights a green box target zone between $4.50 and $8.39, based on Fibonacci levels. This implies a potential upside of roughly 89% to 252% from current prices. While he notes that a further extension toward the $8.39 to $13.36 range is possible, he considers it less likely. Overall, he continues to view XRP as one of the strongest technical setups in the current crypto market.