
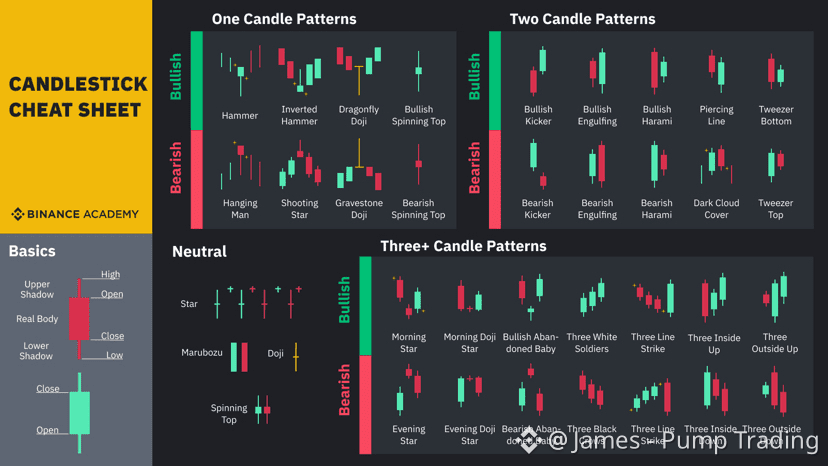


📈 Bullish Candlestick Patterns
These usually appear after a decline or during consolidation and hint at upside potential.
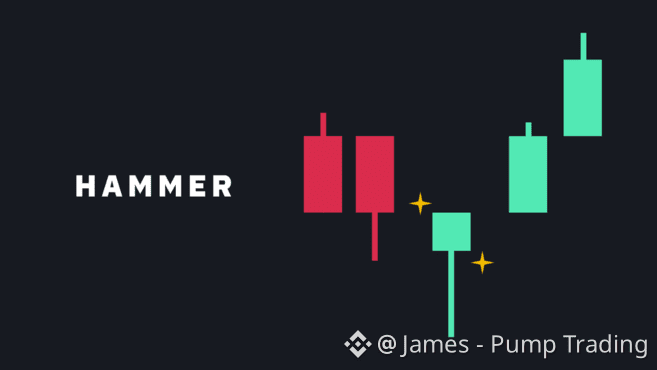
1) Hammer
A small body with a long lower wick. Sellers pushed price down, but buyers stepped in hard and reclaimed control.
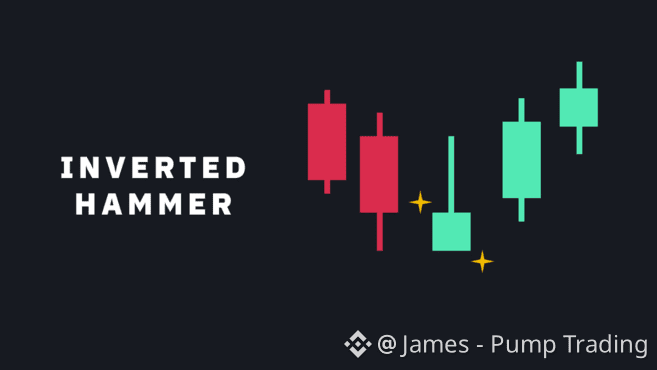
2) Inverted Hammer
Long upper wick, small body. Shows early buying pressure after a downtrend — often a warning sign for bears.
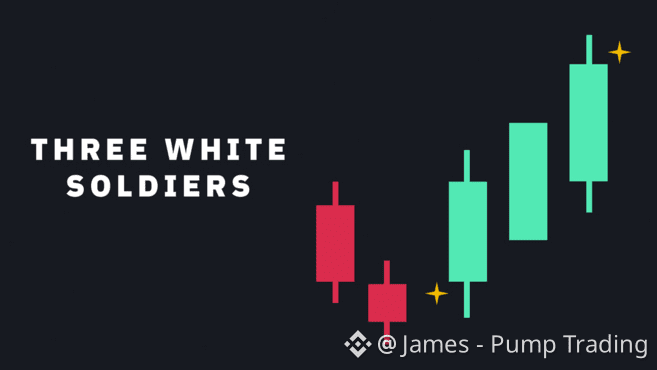
3) Three White Soldiers
Three strong bullish candles in a row, each closing higher than the last. This signals sustained buying strength.
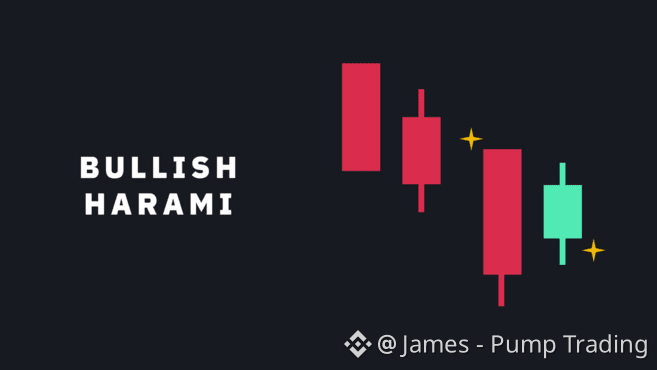
4) Bullish Harami
A small bullish candle forming inside a large bearish one. Momentum is slowing, and a reversal may be forming.
📉 Bearish Candlestick Patterns
These often show up near market tops or after extended rallies.
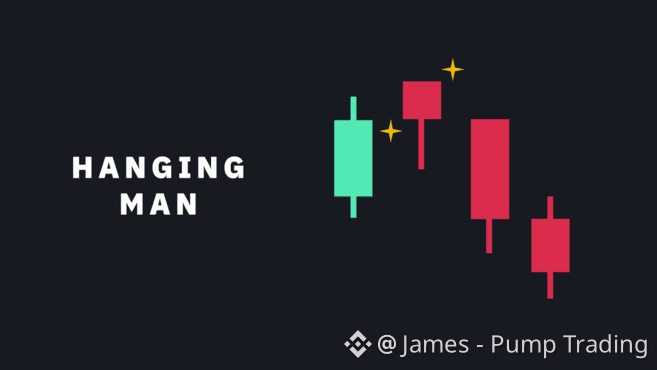
1) Hanging Man
Looks like a hammer, but appears after an uptrend. It signals that sellers are starting to push back.
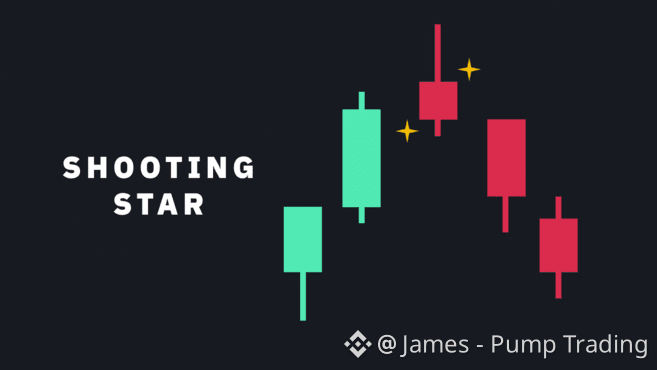
2) Shooting Star
Long upper wick with a small body. Buyers tried to break higher and failed — sellers took control.
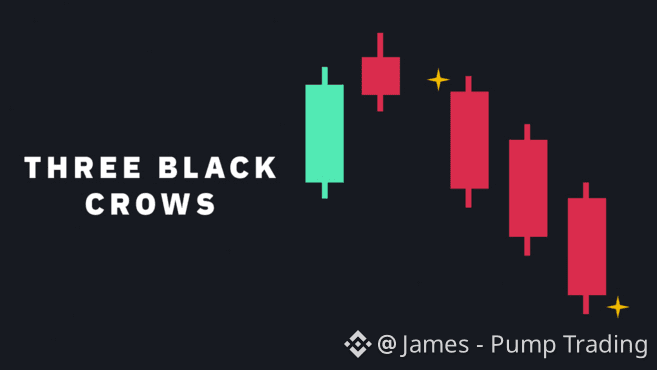
3) Three Black Crows
Three consecutive strong bearish candles. Clear sign of aggressive selling pressure.
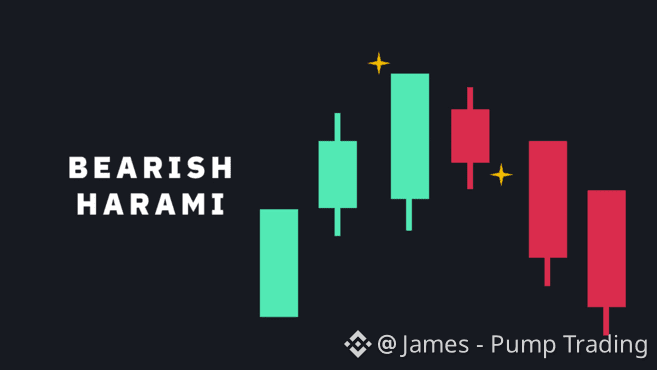
4) Bearish Harami
A small bearish candle inside a large bullish one. Indicates weakening buyer momentum.
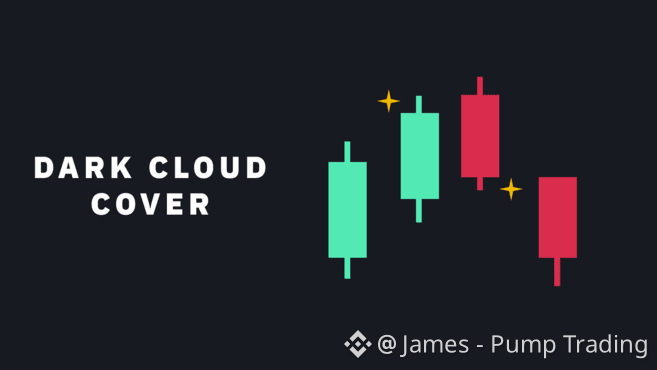
5) Dark Cloud Cover
A bearish candle that opens above the previous candle’s close but closes below its midpoint. Strong rejection from higher prices.
📍 Continuation Patterns
These suggest the trend is pausing — not reversing.
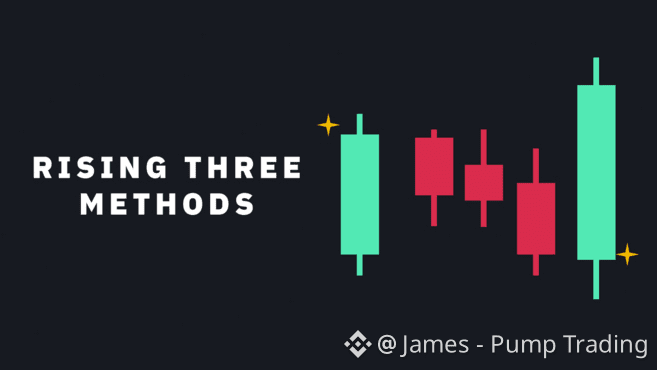
1) Rising Three Methods
A strong bullish candle, followed by a few small pullback candles, then another strong bullish continuation.
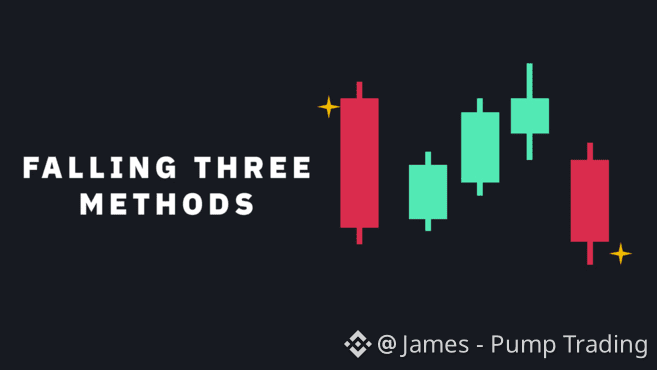
2) Falling Three Methods
The bearish version — consolidation before continuation lower.
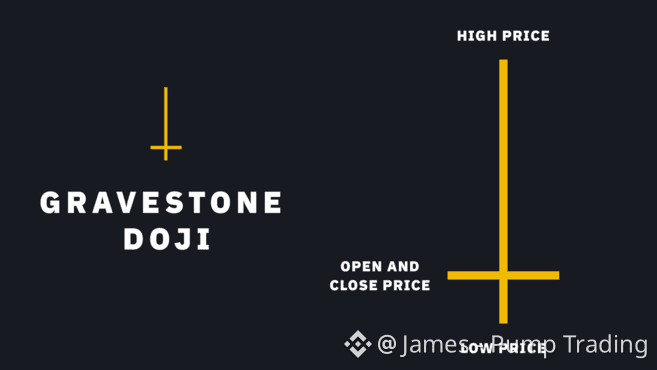
📍 Doji Candles (Indecision)
A Doji forms when the open and close are nearly the same.
1) Gravestone Doji: strong rejection from above
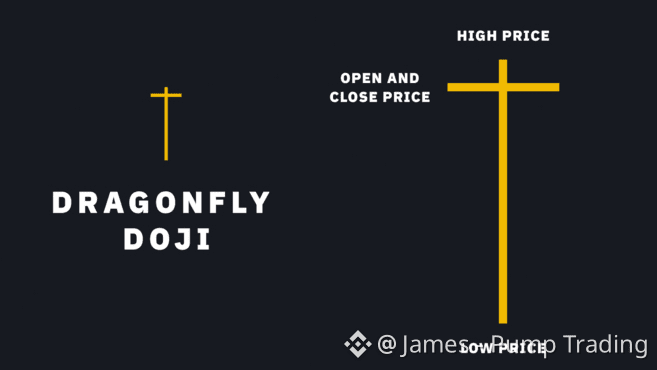
2) Dragonfly Doji: strong rejection from below
3) Long-Legged Doji: extreme uncertainty
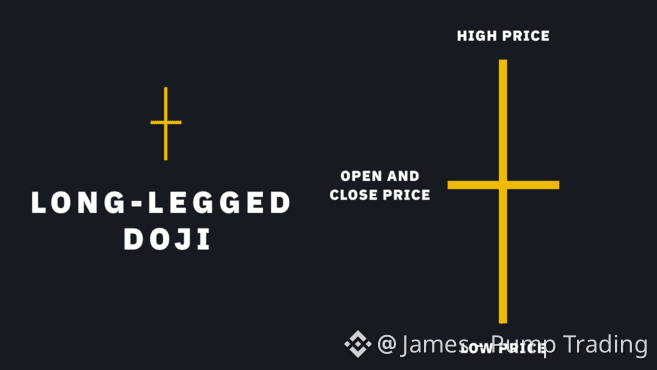
Dojis don’t predict direction by themselves — context is everything.
‼️ Final Thought
Candlestick patterns are not buy or sell signals on their own.
They work best when combined with: Support & resistance - Trend structure - Volume - Momentum indicators.
Read candles as market behavior, not magic signals — and your chart reading will level up fast.
$BTC $ETH $SOL #studywithpumptrading