Vanar Chain (VANRY) is currently in a state of short-term consolidation after recent volatility, with its price finding a new lower range. The focus is now on whether it can hold key support levels amid broader market uncertainty.
Here is a snapshot of its current status (as of ~January 25, 2026):
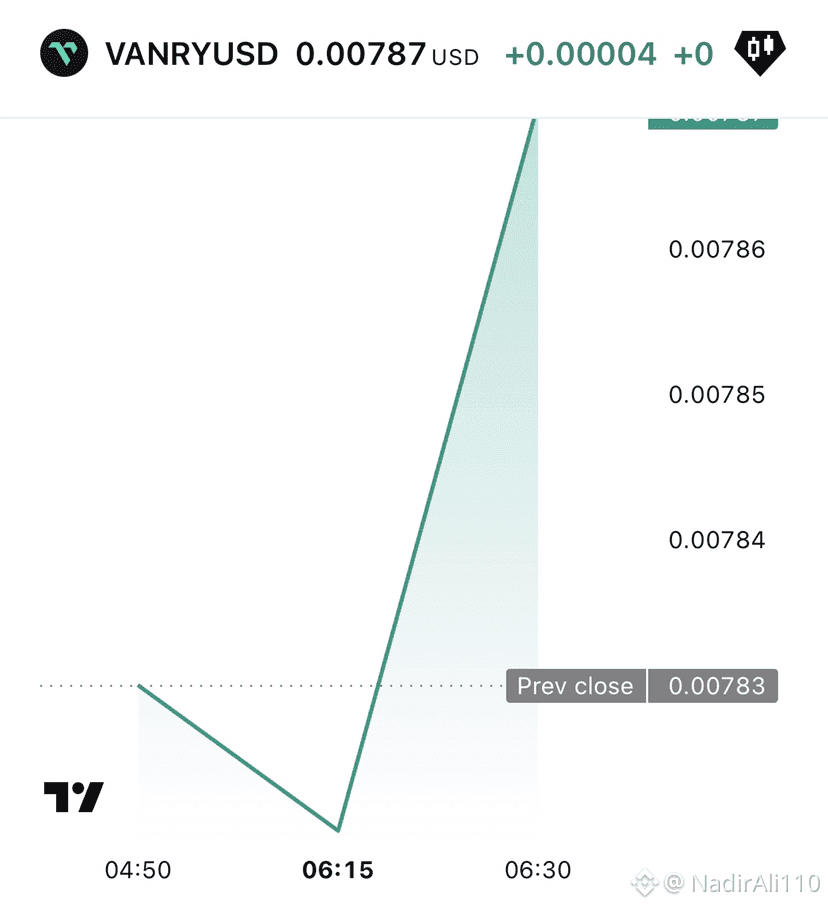
Current Price & Market Metrics
· Current Price: $0.007808
· 24h Change: -3.14%
· Market Cap: ~$17.4M
· Circulating Supply: ~2.23B VANRY
· All-Time High (2021): $1.22 (-99.36%)
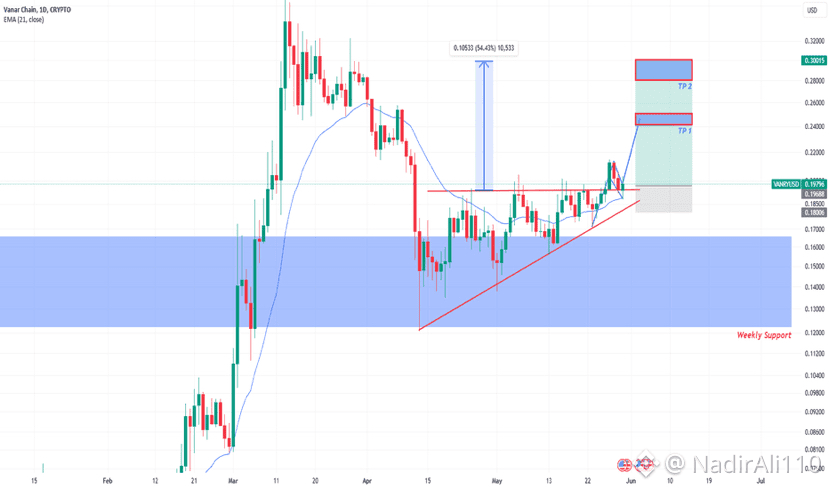
📈 Technical Analysis: Bearish Pressure Across Timeframes
Here is a summary of technical signals from different timeframes:
Weekly Timeframe
· Trend: Bearish
· Key Moving Averages: Price below both 50 & 200-day MA
· Outlook: Dominant downtrend since mid-2025
Daily Timeframe
· Trend: Bearish
· Key Level: Trading below 7-day ($0.00895) and 30-day ($0.00836) SMAs
· Indicator: Negative MACD confirms bearish momentum
· Outlook: Short-term resistance established; key support at ~$0.00717
4-Hour Timeframe
· Trend: Bearish
· Indicator: Falling 50-day MA suggests weakening short-term trend
· Outlook: Mixed signals with potential for volatility
📊 Recent Price Action & Volatility
To understand the current price, it's helpful to see the recent trading pattern over the past month.
Price Movement (Last 30 Days)
Here's a look at how the price has fluctuated:
· High: ~$0.011866 (Jan 18)
· Low: ~$0.007169 (Dec 31)
· Current Range: Consolidating between ~$0.0078 and 0.0081