
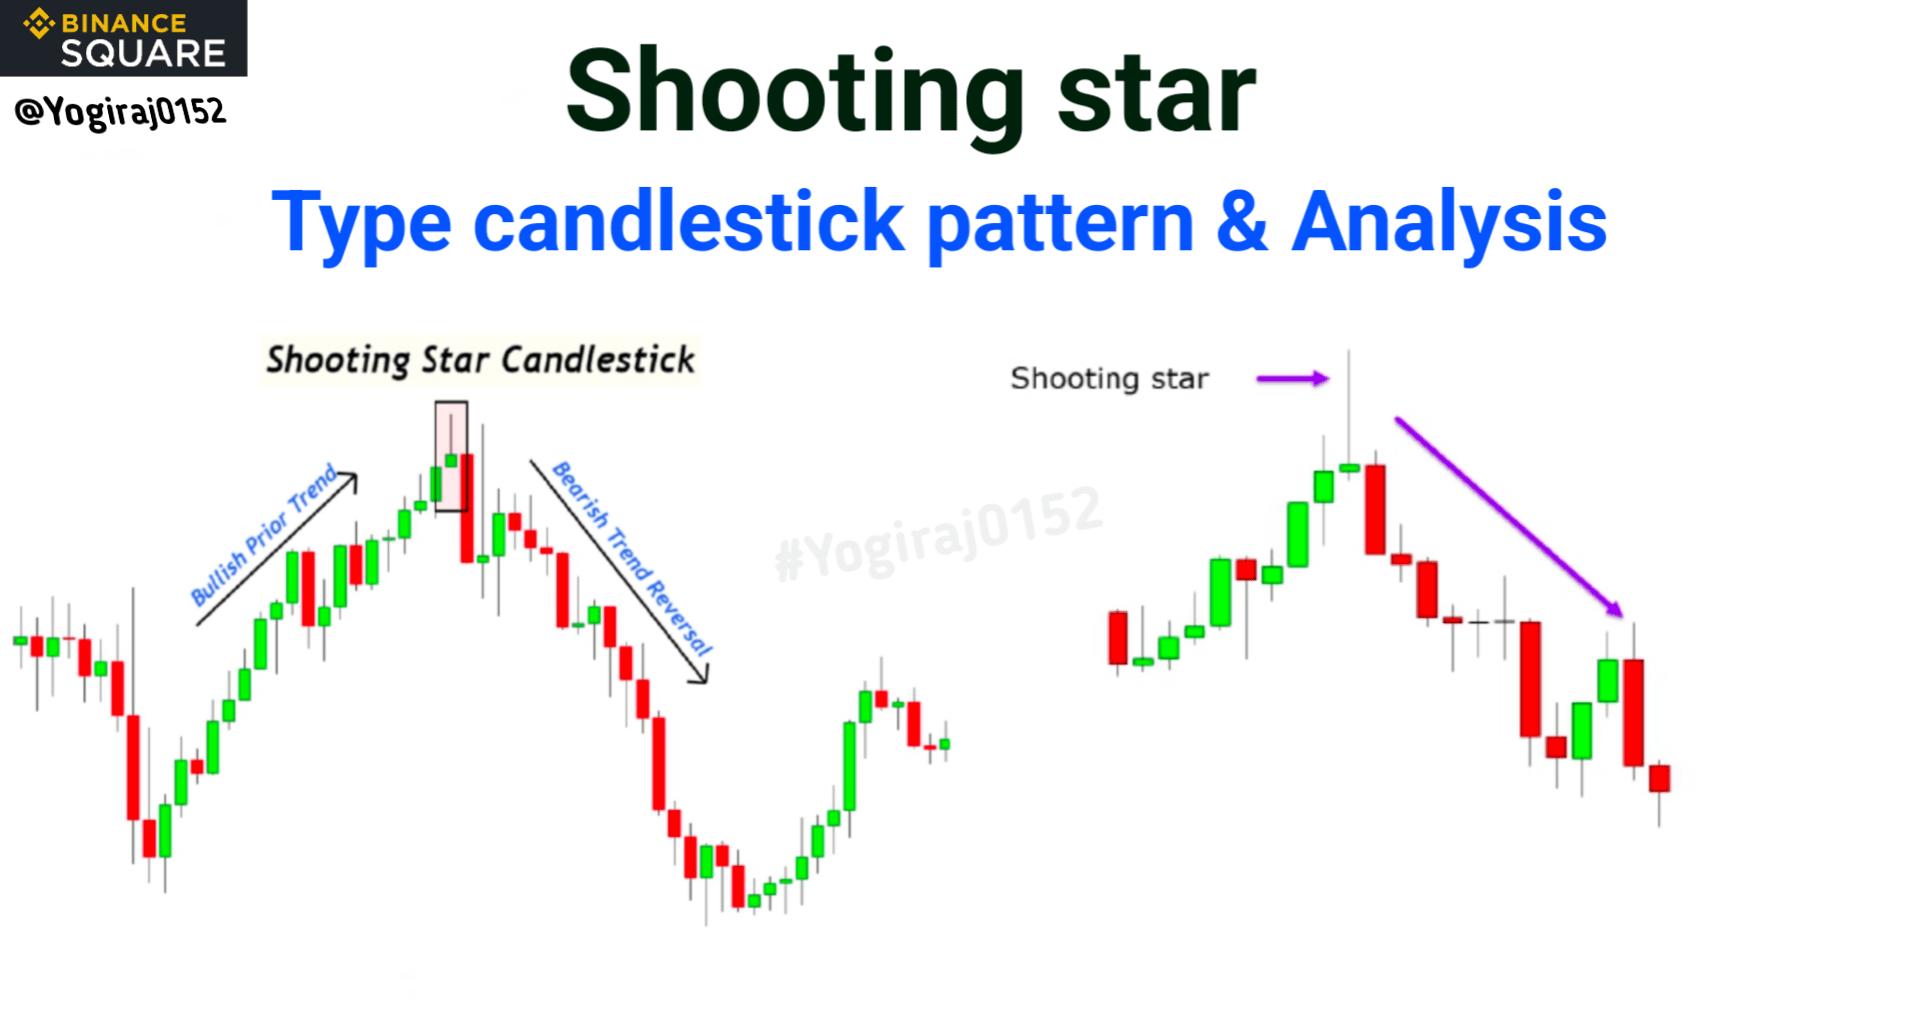
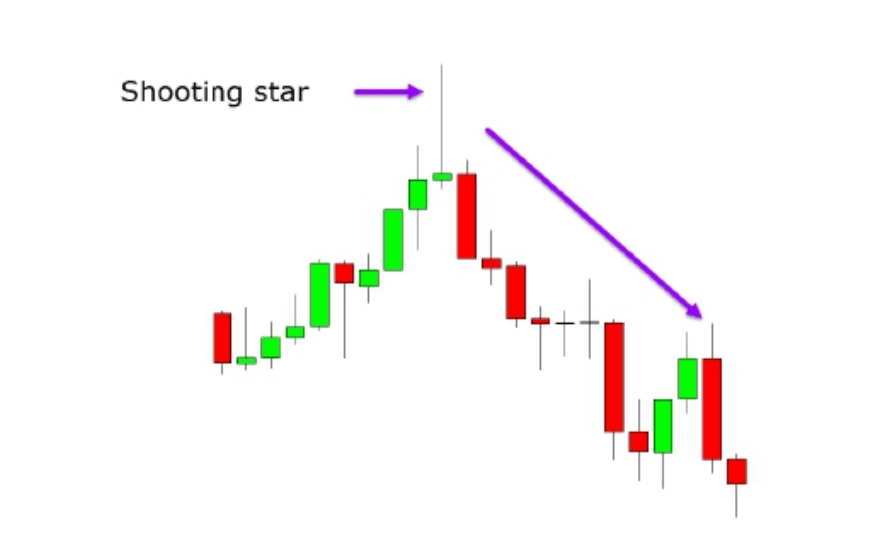
Lumânarea stea căzătoare se formează în vârf. Se formează în vârf după un raliu puternic pe piață. Volumul său este mai mare decât lumânarea anterioară. Pentru a lua o tranzacție aici, prețul de deschidere al noii lumânări secundare ar trebui să fie la prețul de închidere al stelei căzătoare. Când noua lumânare coboară sub prețul minim al lumânării stea căzătoare, ar trebui să fie creată o poziție de vânzare.
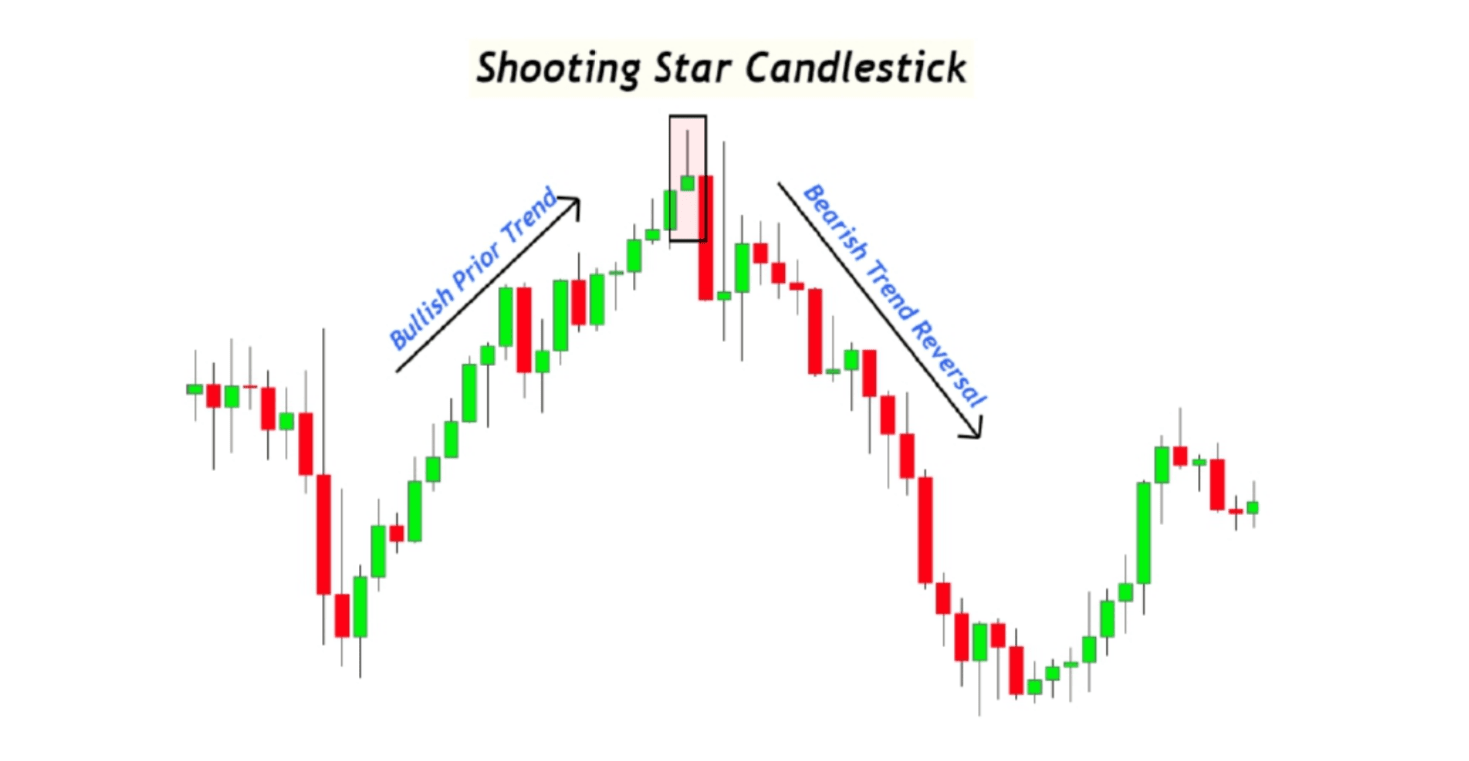
Împreună cu aceasta, un stop-loss ar trebui să fie plasat la prețul maxim al stelei căzătoare. Modelul de lumânare stea căzătoare se formează în graficele intraday, graficele zilnice și graficele săptămânale. Dacă faci tranzacții intraday, atunci ar trebui să fie văzut pe grafice de 5 minute, 10 minute sau 15 minute și dacă faci tranzacții poziționale, atunci ar trebui să fie văzut pe graficele zilnice sau săptămânale.


#Shootingstar #CandlestickPatterns #Write2Earn #Yogiraj0152 #binancesquareofficial
👉🏻Dacă îți place👍🏻 articolul, atunci dă un like și împărtășește, dacă vrei să spui ceva legat de articol, atunci comentează, cu siguranță îți vom răspunde. ✅Urmează-ne astfel încât toate articolele, postările și videoclipurile noastre viitoare să ajungă la tine. Dacă ai obținut informații bune din postarea noastră, atunci ne poți oferi și tu sugestii. Îți mulțumim că ai citit postarea!🙏🏻😊
⚠️ AVIZ:
Acest post este doar pentru scopuri educaționale / informative. Nimic din ceea ce conține acest document nu ar trebui să fie interpretat ca sfat financiar, sfat de investiție sau o recomandare. Piața crypto este extrem de riscantă. Efectuează propria cercetare și consultă un consilier financiar înainte de a lua orice decizie. Autorul / pagina nu este responsabil pentru niciun profit / pierdere.
"Acționează pe riscul tău.”