
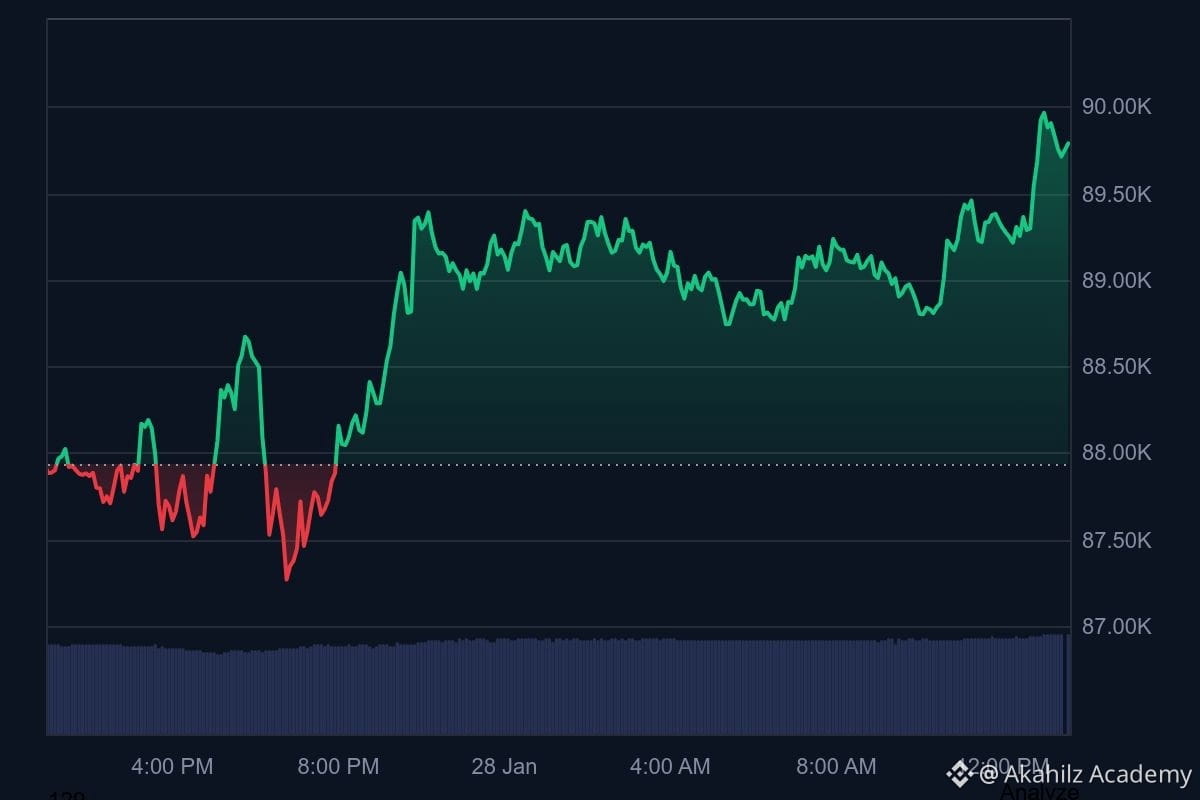
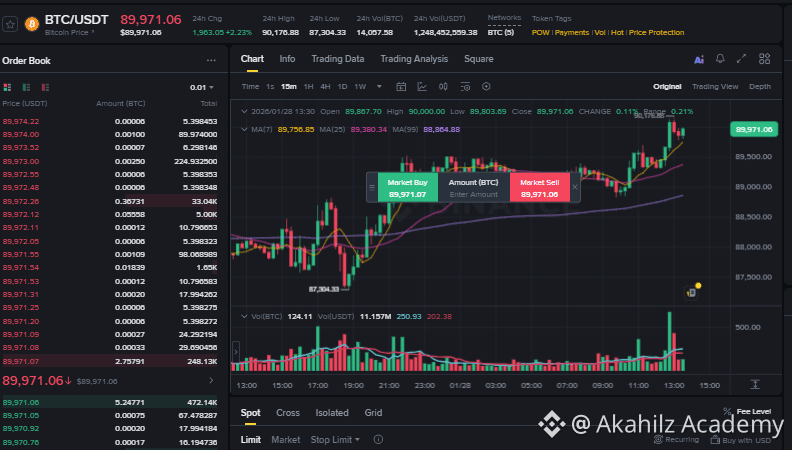
Bitcoin is currently sitting at a pivotal psychological and technical level around the $89,000 mark. After a period of intense volatility that saw rapid swings and liquidations, the market has entered a phase of consolidation, forming patterns that have both the bulls and bears making their cases. The critical question on everyone's mind is: Are we seeing the formation of a bearish 'rising wedge' pattern that signals an imminent drop, or is this merely a 'bull flag' consolidation before the next bullish pump?
Let's take a look at the breakdown of the current technical indicators, market sentiment, and key drivers that will likely determine BTC's next major move.
The Bear Case: The Rising Wedge & Overheating Indicators
The primary concern for cautious traders is the potential formation of a "rising wedge" pattern on the daily and 4-hour charts.
A rising wedge is typically considered a bearish reversal pattern that forms when price action is contained within converging, upward-sloping trendlines. It indicates that bullish momentum is slowing down with each new high.
Slowing Momentum: Indicators like the Relative Strength Index (RSI) are showing signs of divergence, where the price makes higher highs but the RSI makes lower highs, a classic sign of weakening bullish conviction.
Leverage Concerns: Open interest remains high, suggesting a market heavily reliant on leverage. A potential downside break could trigger a cascade of long liquidations, sending the price tumbling toward key support levels around $85,000 or even $78,000.
The Bull Case: The Bull Flag & Institutional Inflows
On the flip side, optimistic investors and technical analysts see the current consolidation as a healthy "bull flag" or "pennant" pattern—a pause for breath after a strong upward move, which usually precedes a continuation of the previous trend.
Strong Support: The $86,000-$90,000 area is acting as a strong demand zone, with buyers consistently stepping in during dips.
Institutional Demand: The primary bullish driver remains the unprecedented inflow into spot Bitcoin ETFs. Major financial institutions continue to accumulate vast amounts of BTC daily, creating a persistent supply shock that puts upward pressure on the price. This "smart money" accumulation suggests a strong belief in higher long-term valuations.
Halving Effect: The post-halving dynamics, historically leading to supply constraint-driven price rallies, are still in play and provide a strong fundamental backdrop for the bulls.
Key Levels to Watch
The market is coiled, waiting for a decisive break of either the upper or lower trendline of the current trading range.
Breakout Confirmation (Bullish): A sustained daily close above the $91,000 resistance level would likely invalidate the bearish wedge scenario and signal a strong push toward the $95,000 area, with the all-time high of $100,000+ as the next major psychological target.
Breakdown Confirmation (Bearish): A clear break and hold below $86,000 would confirm the bearish pattern, likely leading to a test of the lower support zones mentioned earlier.
Conclusion
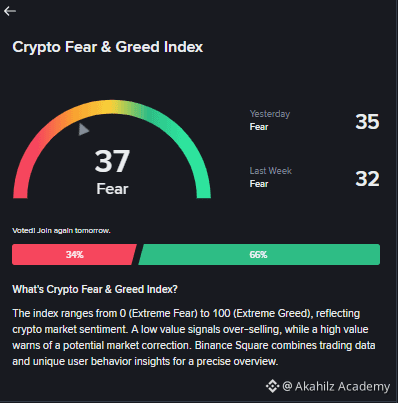
The current Bitcoin landscape is a textbook battleground between short-term technical caution and long-term fundamental strength. The increased volatility is a direct result of this tension.
Whether we get a final shakeout dip or an immediate pump will depend on which side—retail leverage or institutional demand—blinks first. Risk management is paramount in this volatile environment. Stay alert, watch the key levels, and position yourself carefully for the next big move.