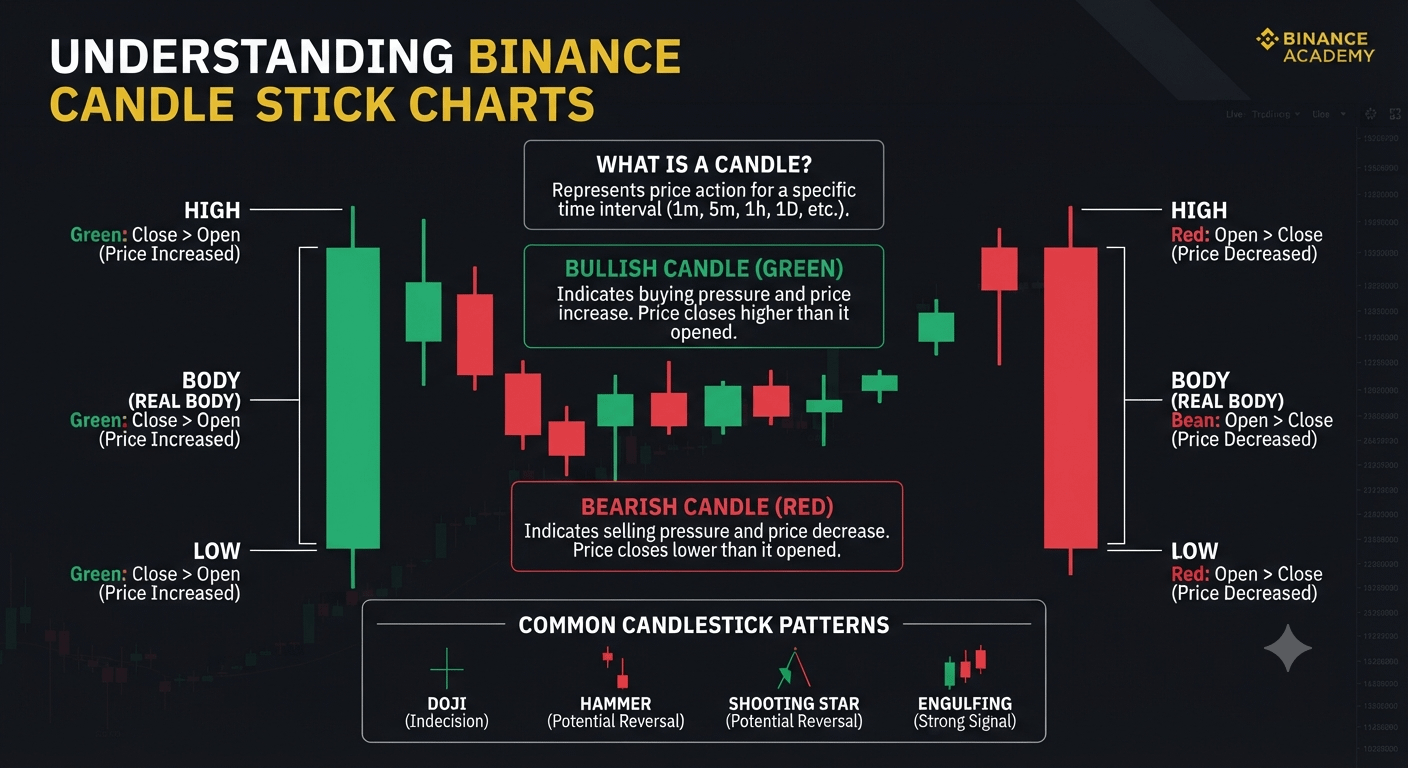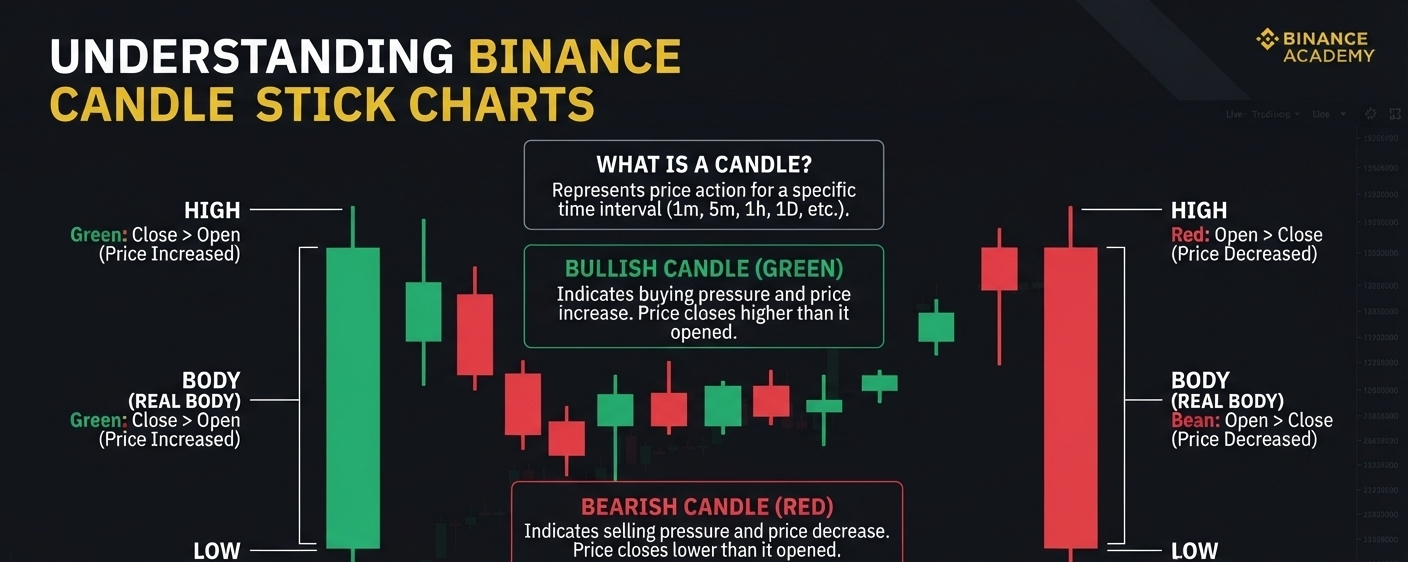
Anatomy of a Candlestick
High/Low: The vertical lines (often called wicks or shadows) represent the highest and lowest prices reached during that time period.
Body (Real Body): The thicker middle section represents the range between the opening and closing price.
Understanding the Colors
Bullish Candle (Green): This indicates buying pressure. It shows that the price closed higher than it opened, meaning the asset increased in value during that interval.
Bearish Candle (Red): This indicates selling pressure. It shows that the price closed lower than it opened, meaning the asset decreased in value.
Common Patterns
Traders often look for specific formations to help predict future market movement, such as:
Doji: Represents market indecision.
Hammer & Shooting Star: Often viewed as signals of a potential trend reversal.
Engulfing: Viewed as a strong signal of a likely change in market direction.