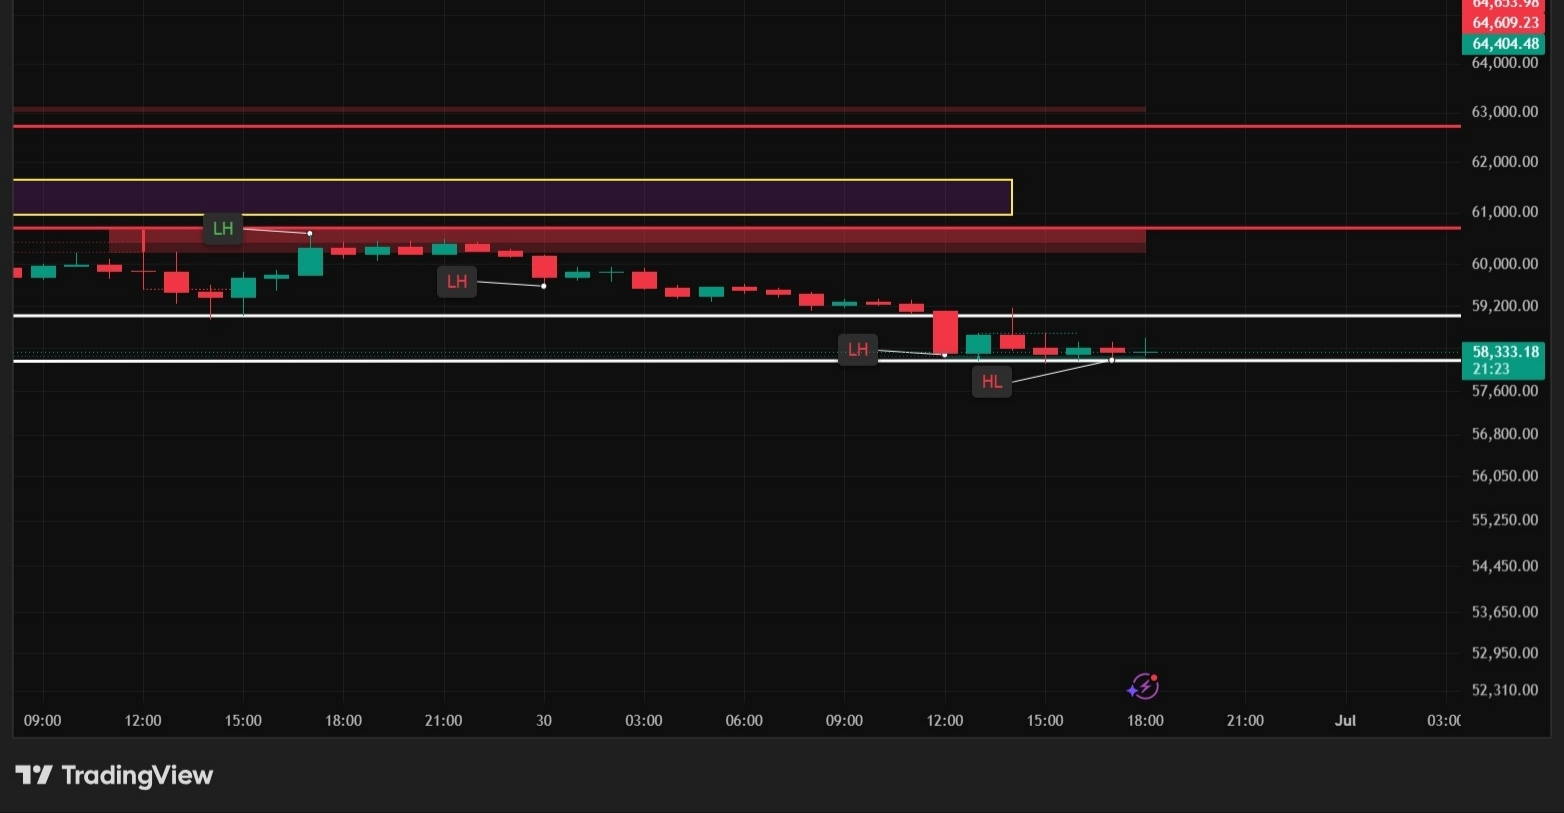
@Bitcoin (BTC) has lost the key $58,500 support level, shifting short-term momentum in favor of the bears. The breakdown follows a series of Lower Highs (LH), indicating that buyers are struggling to regain control while sellers continue to defend higher resistance levels.
Market Structure
The chart shows $BTC trending lower after repeated rejections from the $60,800–61,200 resistance zone. Price is now attempting to stabilize around $58,300, where a small Higher Low (HL) is forming. This suggests buyers are trying to defend the area, but a strong recovery is still needed to confirm a reversal.
Key Levels to Watch
Immediate Resistance: $58,500
Major Resistance: $60,800 – $61,200
Major Resistance Zone: $61,000 – $61,800
Current Support: $57,800
Major Support: $57,000
Bullish Scenario 🚀
If BTC quickly reclaims $58,500 and closes above it with strong buying volume, the breakdown could turn into a bear trap. In that case, the next upside targets would be $60,800–61,200, followed by the $61,800 resistance zone.
Bearish Scenario 📉
If sellers keep BTC below $58,500 and price loses the $57,800 support, the next downside target is $57,000. A break below this level could trigger further selling pressure.
Final Thoughts
Bitcoin is trading at a crucial decision point after breaking below $58,500. Bulls need to reclaim this level to restore bullish momentum, while failure to do so could extend the correction toward lower support zones. The next few candles will likely determine the market's short-term direction.
DYOR (Do Your Own Research). This analysis is for educational purposes only and not financial advice.
#SamsungSKHynixSharesRiseYTD #DowHitsRecordClose #AzerbaijanDraftsVirtualAssetBillRequiringCentralBankLicense #sniperchart #binance