

Marvell stock enters July with a structurally bullish daily chart, yet the intraday picture tells a more complicated story. After a 45% surge fueled by AI custom silicon demand, MRVL is showing signs of near-term exhaustion. Price closed at $272.05, retreating sharply from a session high of $292.50.
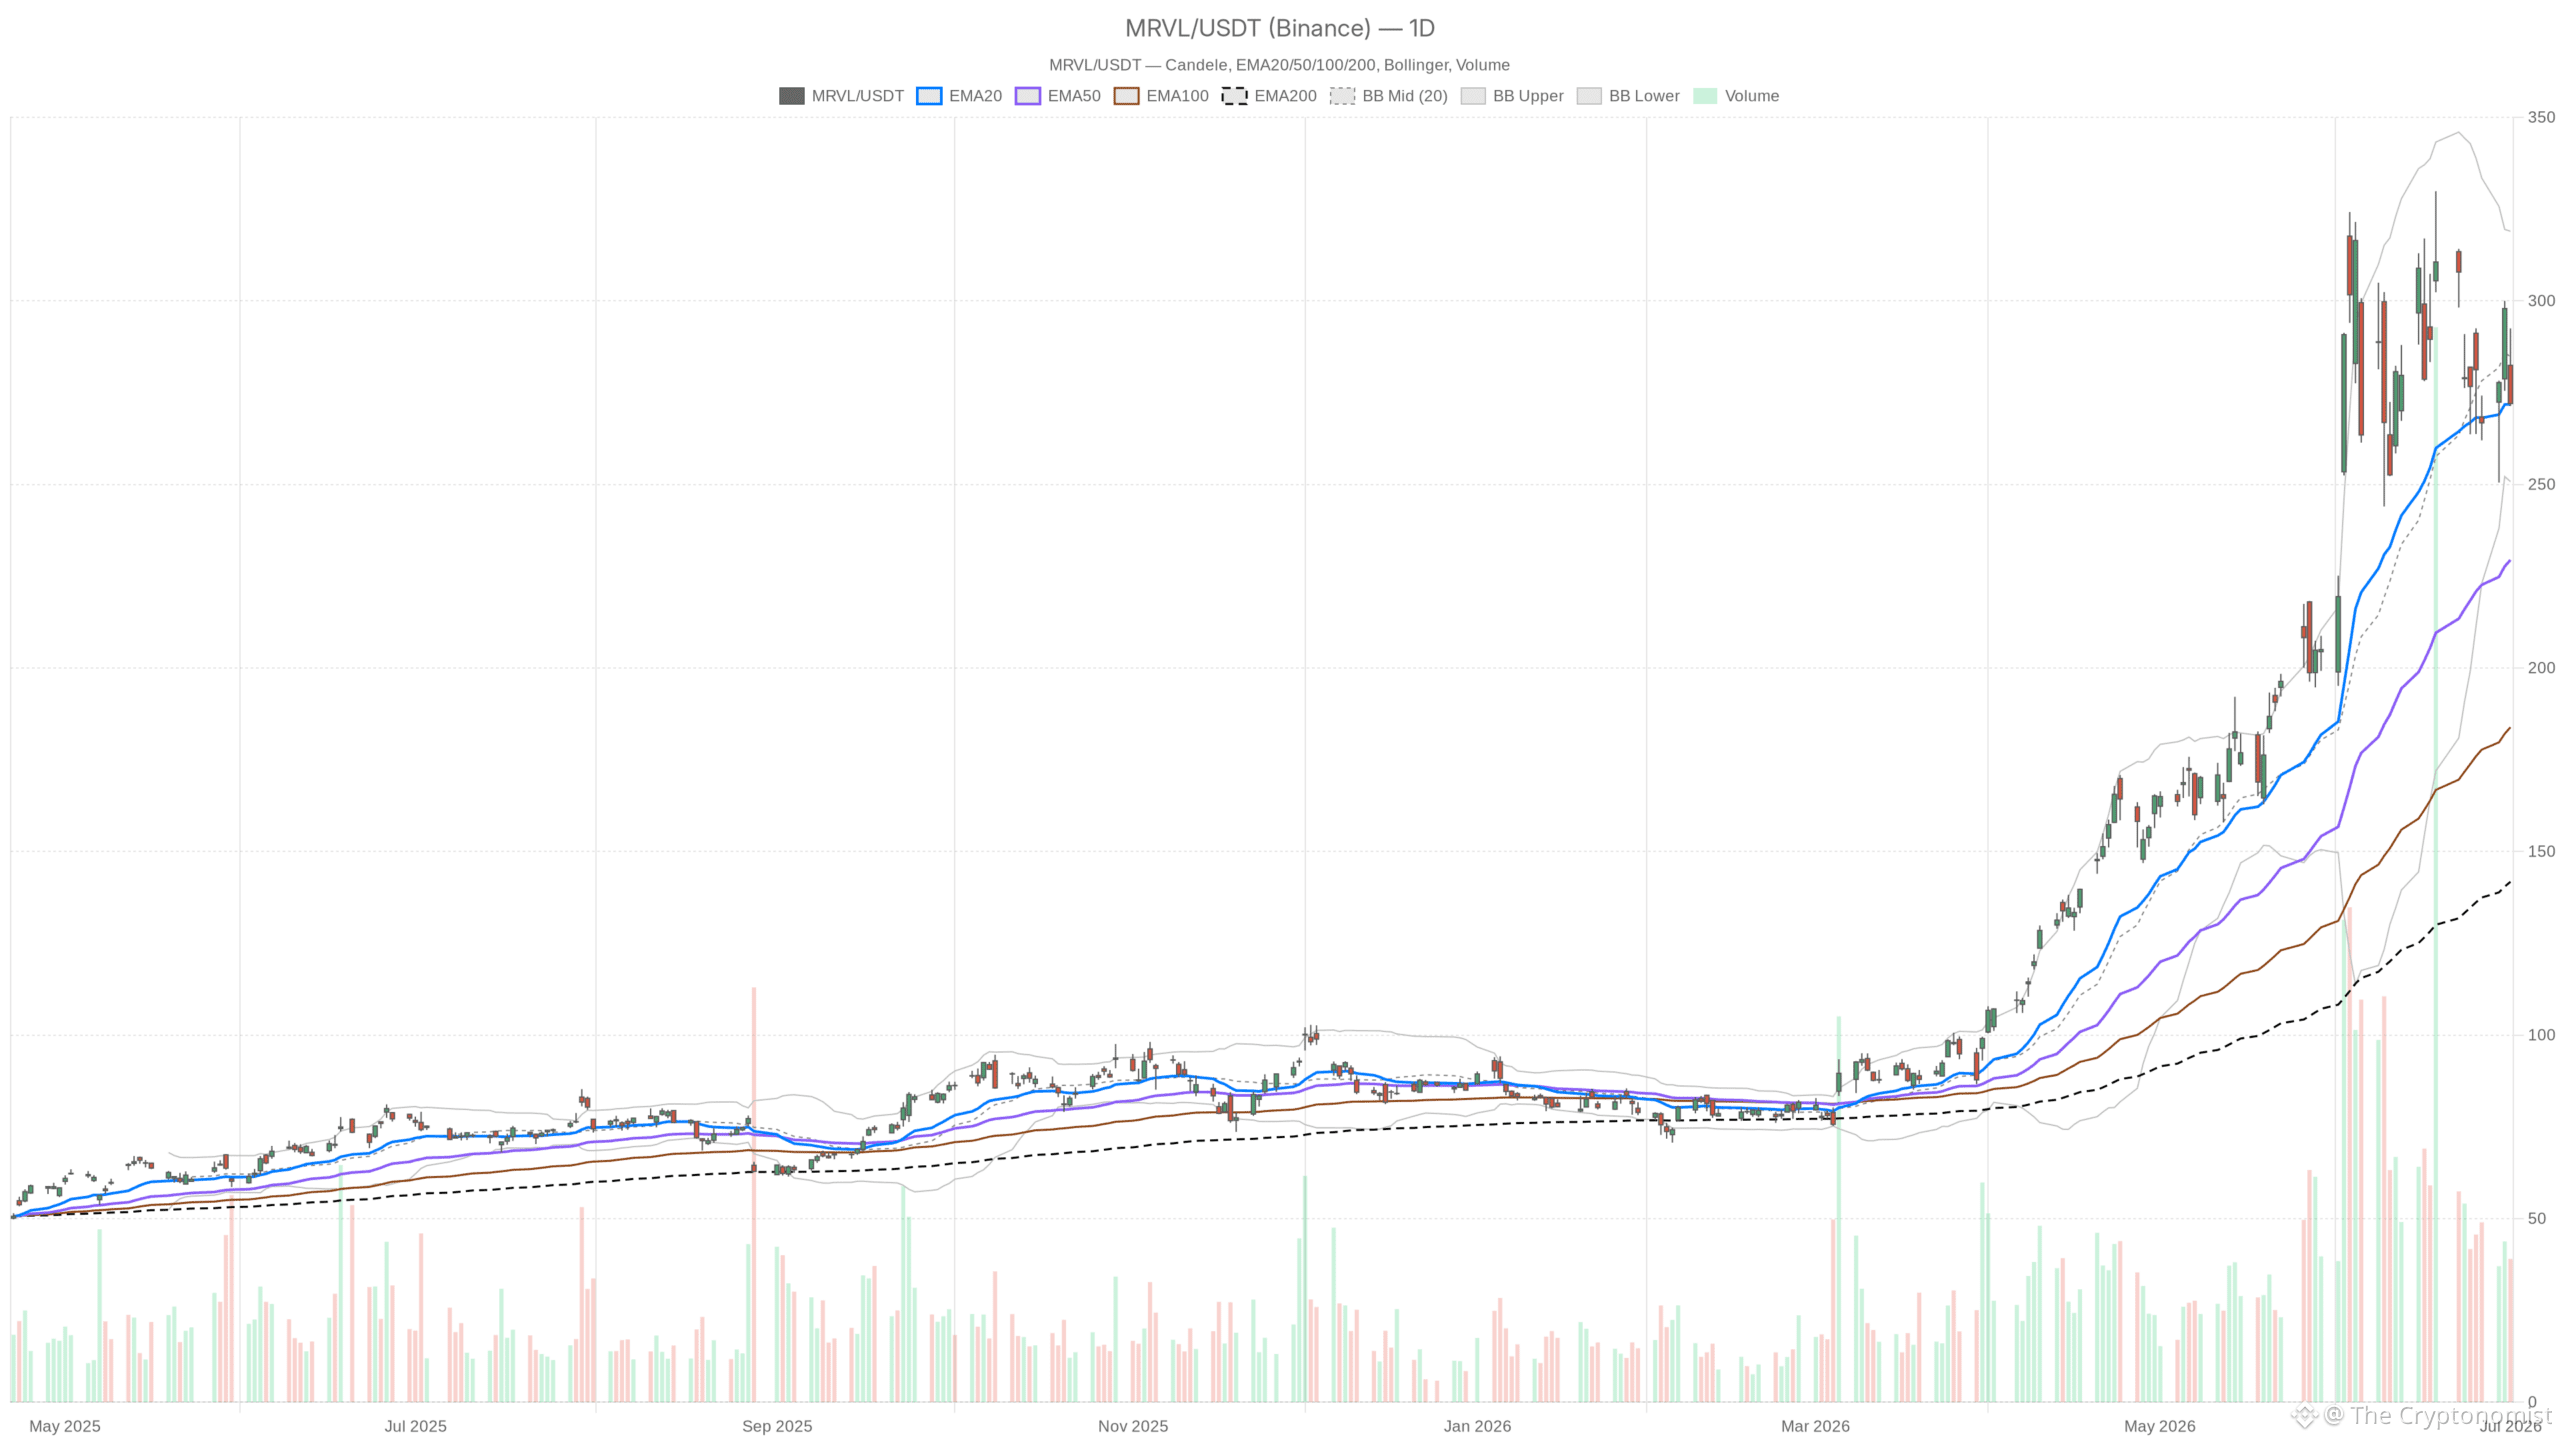 MRVL — daily chart with candlesticks, EMA20/EMA50 and volume.
Key takeaways
MRVL trades at $272.05, holding above all major daily moving averages despite a sharp intraday reversal from $292.50.
Daily MACD has crossed below its signal line with a widening negative histogram, signaling decelerating upside momentum after a 45% monthly rally.
Hourly and 15-minute timeframes both show bearish leanings, with price trading below short-term EMAs across both frames.
The daily EMA20 at $271.80 is the critical line in the sand; a close below it would materially shift the near-term outlook.
With a daily ATR of $27.45, Marvell stock carries asymmetric volatility risk in both directions, favoring disciplined positioning over aggressive directional bets.
Daily Timeframe: Bullish Regime, But Momentum Fading
Marvell stock’s daily chart remains structurally bullish, with price holding above all major moving averages — but momentum indicators are flashing early caution signals. MRVL trades at $272.05, comfortably above the EMA20 at $271.80, the EMA50 at $229.42, and the EMA200 at $141.75. The enormous spread between those averages confirms a prolonged, multi-month uptrend with strong structural support well below current levels.
MACD Divergence Signals Cooling Momentum
However, the daily MACD is showing the first serious warning sign. The MACD line sits at 17.16, still positive, but has crossed below its signal line at 22.66. The resulting histogram reads -5.50 and is widening — not yet a reason to panic, but a clear signal that upside momentum is decelerating. After a 45% monthly rally, some cooling is entirely normal. The real question is whether this becomes a shallow consolidation or the start of a deeper correction.
Daily RSI at 52.49 reinforces the measured view. It sits in neutral territory — neither overbought nor oversold — after what must have been an extremely extended reading during the June rally. That RSI reset suggests Marvell stock has already digested a meaningful portion of the recent move without unraveling the broader trend.
Bollinger Bands and Pivot Levels
The Bollinger Bands place the midline at $284.86, with the upper band at $318.96 and the lower at $250.77. At $272.05, price has slipped below the midline — a subtle but relevant shift. Sustained trading below it would indicate sellers are controlling the near-term narrative. The ATR of $27.45 underscores how volatile this name is; a single daily candle can easily swing several percentage points.
Daily pivot analysis puts the pivot point at $278.63, with resistance at $285.92 and support at $264.76. The close beneath the pivot is a mild negative signal. Should MRVL fail to reclaim $278.63 with conviction, selling pressure is more likely to test the $264.76 support level in subsequent sessions.
Hourly Timeframe: Trend Has Turned Neutral
On the hourly chart, Marvell stock’s trend has flipped to neutral, with price now trading below both the EMA20 and EMA50 — a clear short-term deterioration. Price at $271.95 sits beneath the EMA20 at $280.44 and the EMA50 at $281.28. That alignment places short-term moving average resistance directly overhead, complicating any attempt at a quick recovery. The 1H EMA200 at $261.47 remains below price, still offering a broader support floor.
Momentum and Volatility Context
The hourly MACD reinforces the bearish short-term lean. The MACD line is at -0.34, below the signal at 1.47, generating a histogram of -1.81. Momentum is negative on this timeframe, fully consistent with the day’s sharp intraday reversal. Meanwhile, the 1H RSI at 41.51 approaches oversold territory without quite reaching it — a zone that sometimes produces bounces, but also one that can persist during genuine downward pressure.
On the Bollinger front, the hourly midline sits at $282.37, with price printing significantly below that level. The 1H ATR of $7.57 means the stock can move roughly $7–$8 within a single hour under stressed conditions. Hourly pivot support is at $269.06. A clean break below that level would expose Marvell stock to the $261–$262 zone.
15-Minute Timeframe: Oversold, But Still Bearish
At the execution level, the 15-minute chart shows Marvell stock in the most bearish posture across all timeframes, with a complete EMA stack inversion. Price trades below all three EMAs — the EMA20 at $277.31, EMA50 at $280.35, and EMA200 at $282.41. That textbook bearish alignment leaves no ambiguity about the near-term directional pressure.
Notably, the 15m RSI at 33.74 is approaching the oversold threshold near 30. At the same time, the MACD histogram at 0.22 is marginally positive — a potential early signal that downward momentum is beginning to stall at the micro level. In terms of execution, the 15m pivot support at $270.10 is the key level to watch. A hold there with volume would be the first green flag for any intraday recovery attempt.
Fundamental Backdrop: AI Tailwind Meets Valuation Skepticism
Marvell stock’s technical softness aligns with growing valuation concerns, even as the AI custom silicon narrative remains one of the strongest in the semiconductor space. The company’s positioning in custom silicon development and optical interconnects continues to attract serious investor attention. Q1 FY2027 results delivered growth, and comparisons with Broadcom underscore how seriously the market is treating MRVL’s role in the AI chip supply chain.
Still, valuation questions are becoming louder. After a 428% five-year total return and a 45% surge in a single month, multiple analysts have flagged the stock as expensive. A Seeking Alpha analyst downgrade on June 30 cited both valuation risk and execution concentration risk — specifically, the degree to which Marvell’s growth forecast depends on a single, high-stakes strategic bet. That concentration creates binary risk: execute flawlessly and the valuation is justified; stumble once and the re-rating could be severe.
Bullish Scenario: What Would Reignite the Rally
For Marvell stock to regain bullish momentum, a recovery above the daily pivot at $278.63 and a reclaim of hourly EMAs near $280–$281 would be the first required steps. Should MRVL push back toward $285.92 — the daily R1 — with expanding volume, the bullish thesis would strengthen considerably. Positive catalysts could include further confirmation of AI custom silicon design wins or broader sector optimism driven by hyperscaler capex commentary.
The daily EMA20 at $271.80 is currently acting as a precise line in the sand; the stock essentially closed on top of it. As long as daily closes hold above that level, the bull case for a continuation toward the upper Bollinger Band at $318.96 — though ambitious in the near term — remains technically alive.
Bearish Scenario: Where the Thesis Breaks Down
Marvell stock’s bullish thesis would face serious damage on a daily close below the EMA20 at $271.80. That would shift immediate support focus to the daily S1 at $264.76 and the lower Bollinger Band at $250.77. Given the daily ATR of $27.45, a move to $250 would not be structurally unusual — it would simply represent a deeper but still normal pullback within a larger uptrend.
The more bearish scenario involves the MACD continuing to deteriorate. If the histogram keeps widening negatively on the daily chart, it would suggest that post-earnings momentum has fully exhausted itself. Combined with valuation headwinds and the analyst downgrade already on the tape, that could attract meaningful profit-taking from institutional holders sitting on large gains from the prior month’s rally.
Positioning and the Volatility Reality
Overall, Marvell stock sits at a crossroads between a powerful structural AI tailwind and a short-term technical correction with genuine momentum behind it. The daily regime is bullish, but momentum is clearly cooling. The hourly and 15-minute frames are both under pressure, creating a genuine timeframe conflict that argues against aggressive directional positioning in either direction.
Therefore, with a daily ATR of $27.45 and an AI narrative that can shift on a single headline, this stock carries asymmetric volatility risk in both directions. Disciplined traders will look for a clear resolution — either a reclaim of the daily pivot and hourly EMAs, or a breakdown below $271.80 — before committing to a directional view. Chasing momentum after a 45% monthly run, without technical confirmation, remains a low-probability strategy in this environment.
FAQ
Is Marvell stock still in a bull market?
Yes, Marvell stock remains in a structurally bullish daily regime, trading above all major moving averages — the EMA20, EMA50, and EMA200. However, daily MACD momentum has begun to fade, suggesting the trend is cooling rather than accelerating. The long-term structure is intact, but the near-term picture warrants caution.
What is the most important support level for MRVL right now?
The daily EMA20 at $271.80 is the most critical near-term support for Marvell stock. A daily close below that level would shift focus to the daily S1 support at $264.76, followed by the lower Bollinger Band at $250.77. As long as price holds above $271.80 on a closing basis, the bullish structure remains technically valid.
What would confirm a bullish recovery in Marvell stock?
A recovery above the daily pivot at $278.63 and a reclaim of the hourly EMAs around $280–$281 with expanding volume would signal that the July 1 selloff was a shakeout rather than a trend reversal. Further confirmation would come from a push toward the daily R1 at $285.92.
Why is MRVL showing weakness despite strong AI demand?
Marvell stock surged 45% in a single month, pulling forward a significant amount of future value. Combined with analyst valuation concerns and concentration risk around a single strategic AI bet, the stock is experiencing natural profit-taking and momentum cooling after an extended rally. The fundamental AI narrative remains strong, but price had moved well ahead of near-term fundamentals.
Disclaimer: This article is for informational purposes only and does not constitute financial advice, an investment recommendation, or a solicitation to buy or sell any financial instrument or cryptocurrency. The analysis provided is not indicative of future results. Investing in crypto assets and financial markets carries a high risk of capital loss. Always do your own research (DYOR) and consult a qualified financial advisor before making any decision.
Article produced with the assistance of artificial intelligence and reviewed by the editorial team.