
Palantir stock surged 9.3% to close at $125.73 on July 1st, driven by an AI partnership with Nvidia and news of President Trump’s stake. Yet the daily chart tells a more cautious story — a recovery within a downtrend, not a breakout from one.
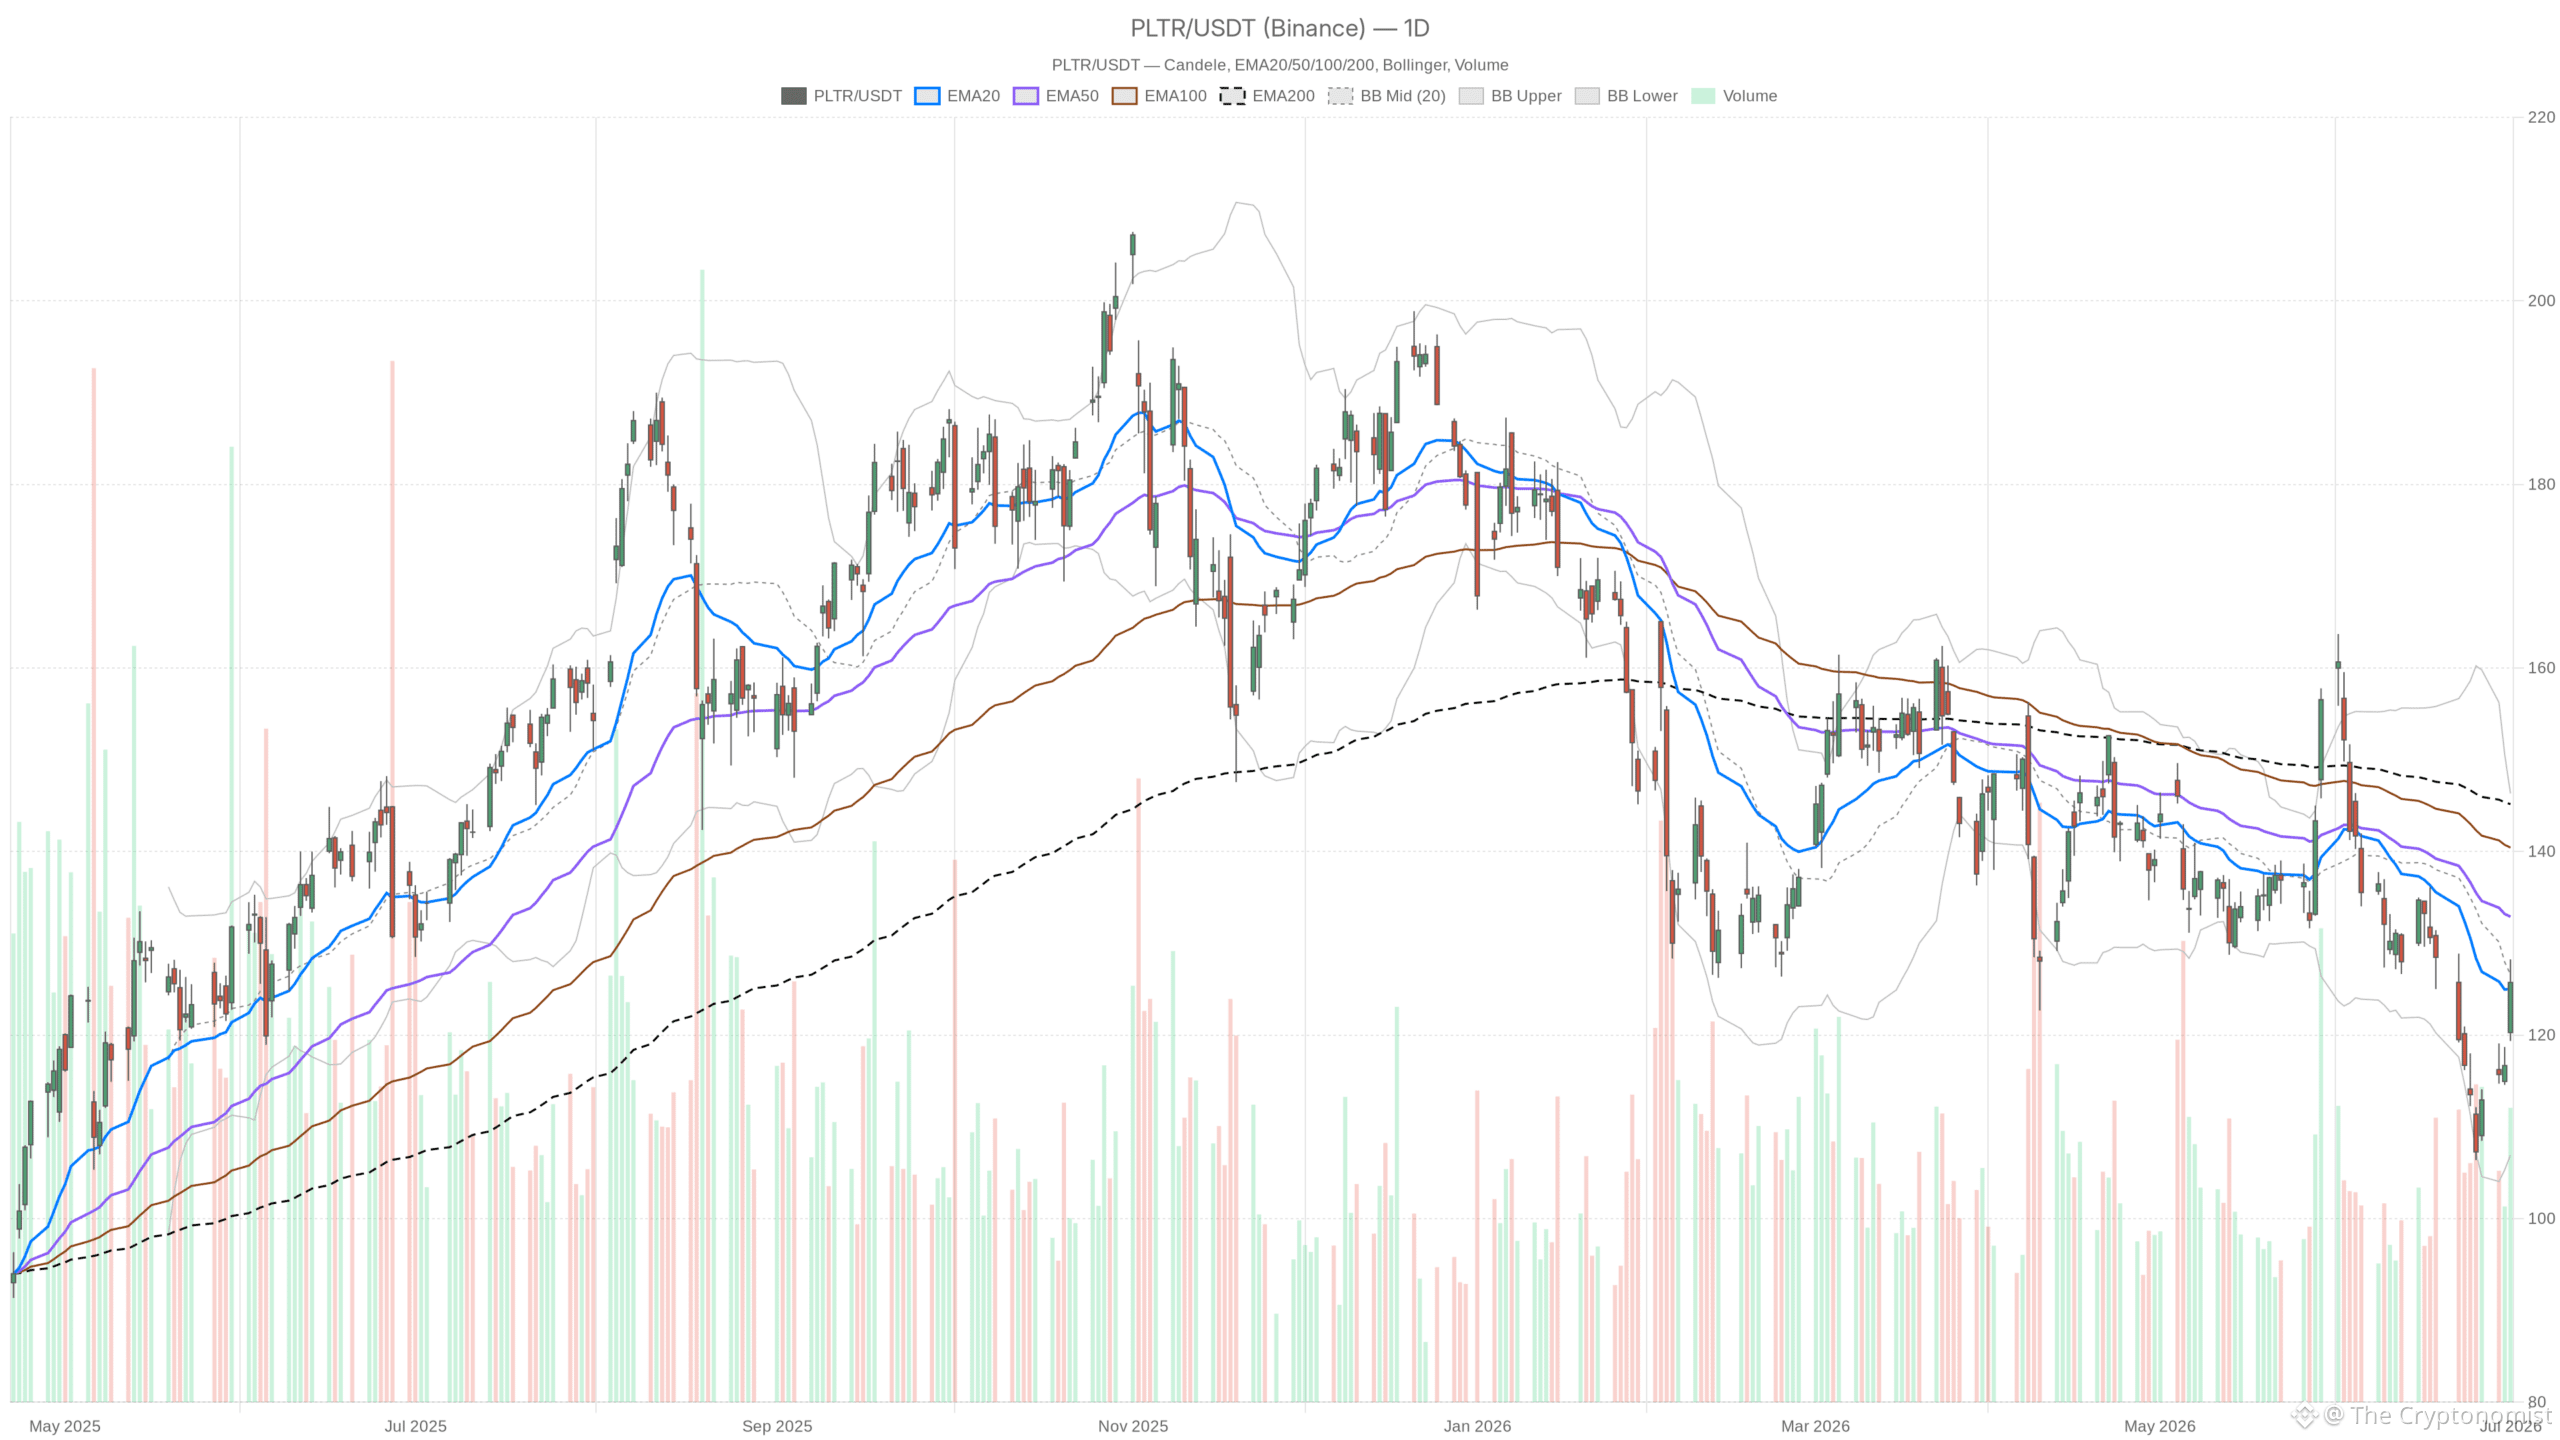 PLTR — daily chart with candlesticks, EMA20/EMA50 and volume.
Key takeaways
PLTR closed at $125.73 after a 9.3% catalyst-driven surge
Daily structure remains bearish with price below EMA50 ($132.90) and EMA200 ($145.17)
Daily RSI at 48.36 reflects neutral momentum, not a confirmed reversal
Hourly chart has turned constructively bullish with RSI at 66.6
A sustained reclaim of the $128–$133 zone is needed to challenge the bearish regime
Palantir Stock Daily Chart Remains Bearish
The daily structure on Palantir stock remains bearish despite the sharp catalyst-driven bounce. Price sits below all three major moving averages.
The daily bias on PLTR is structurally bearish. Price sits below the EMA50 at $132.90 and well beneath the EMA200 at $145.17. Even the EMA20 at $125.03, which the stock is barely clinging above, reflects a compressed recovery rather than a true trend reversal. All three major moving averages sit above current price — a clear signal that dominant pressure has been to the downside. The news catalyst produced a meaningful bounce, but it has not yet repaired the technical damage.
Meanwhile, the daily RSI at 48.36 sits just below the neutral 50 line. It reflects a market that is healing, not accelerating. The daily MACD reinforces this read: the line at -5.92 remains below the signal at -5.47, with a negative histogram of -0.45. The bearish crossover is still in place. A slight flattening offers an early hint of momentum fatigue on the downside — but no confirmed reversal signal yet.
Palantir Stock Volatility and Key Levels
Palantir stock trades within a wide Bollinger Band range. The daily pivot at $124.44 now serves as the near-term line in the sand for bulls and bears alike.
On the daily frame, Bollinger Bands place the mid-band at $126.62, just above the current close. The stock is attempting to reclaim this level. A sustained hold above the mid-band would be the first meaningful structural signal that selling pressure is easing. The lower band at $106.91 and upper band at $146.32 define an exceptionally wide range. The daily ATR of $6.39 confirms this is a high-volatility name where intraday swings of $5–8 are entirely normal.
In turn, daily pivot levels offer a cleaner near-term framework. The pivot point sits at $124.44, which PLTR closed above. The first resistance level, R1, stands at $129.54 — a key zone to watch on any continuation attempt. Support rests at S1 near $120.64, which aligns closely with the intraday low printed during the session. That level is now the line in the sand for bulls defending the recent catalyst move.
Intraday Charts Flash Bullish Momentum
The 1-hour chart on PLTR has turned constructively bullish on the back of event-driven momentum. However, the 15-minute chart shows price consolidating rather than extending.
On the 1-hour timeframe, the RSI at 66.6 shows real buying momentum. The MACD carries a positive histogram of 0.88 with the line well above signal. Price has surged above both the hourly EMA20 at $121.28 and EMA50 at $119.70, leaving them well below as dynamic support. This intraday structure reflects genuine demand following the Nvidia deal. Still, the hourly EMA200 at $128.05 looms overhead as the next meaningful resistance. That level may act as a ceiling before any larger directional decision is made.
At the same time, on the 15-minute chart, the most recent candle closed at $125.69. The MACD histogram turned slightly negative at -0.48, while the 15m RSI at 51.94 is neutral. Price is compressing just below the 15m Bollinger mid at $127.11, with the upper band at $128.11 capping near-term upside. This short-term consolidation following the intraday surge suggests a market digesting a large move. It does not signal reversal — it signals pause. The $125.24 area marks the nearest 15m support, with $126.55 as resistance on any minor push higher.
The Timeframe Divergence
Notably, the conflict between timeframes is real. The daily frame remains in a bearish regime — declining EMAs, negative MACD, and neutral daily RSI. The hourly frame has turned bullish on the back of event-driven momentum. This divergence is common after sharp catalyst moves. Short-term traders have reason to lean long, while the medium-term structural bias has not yet flipped. The two views are not contradictory — they simply operate on different timescales.
Bullish Scenario for Palantir Stock
The bullish case for Palantir stock rests firmly on the Nvidia partnership. A sustained move above the $128–$133 zone would provide the first meaningful technical confirmation.
The Nvidia partnership signals Palantir is embedding itself deeper into the commercial AI infrastructure layer — a credible and meaningful development. At least one Wall Street analyst has labeled the stock undervalued. Meanwhile, Michael Burry’s retreat from his short position removes meaningful institutional selling pressure.
Technically, a sustained hold above the daily pivot at $124.44 and a move through R1 at $129.54 would represent early confirmation. A reclaim of the hourly EMA200 at $128.05 would strengthen that case further. In that scenario, Palantir stock could target a revisit of the EMA50 zone near $132–$133.
Bearish Scenario for Palantir Stock
The bearish case does not require the Nvidia thesis to fail. It only requires the market to refocus on Palantir’s stretched valuation and the unresolved daily downtrend.
The bearish argument demands the market remember Palantir’s multiple was stretched before this move. Record growth must still justify a valuation under pressure well before the catalyst.
Technically, a failure to hold above $124.44 would be an early warning. A breakdown below S1 at $120.64 would confirm sellers absorbed the intraday surge. The stock would remain trapped beneath all three major daily EMAs. The bearish structure would reassert itself. The next meaningful support below $120 is the Bollinger lower band near $106.91 — a significant distance lower.
Palantir Stock Outlook
Palantir stock sits at an inflection point. The Nvidia catalyst created short-term bullish momentum, but the daily chart has not confirmed a structural reversal.
The Nvidia catalyst delivered exactly the kind of sharp, news-driven momentum that can shift narratives quickly. Yet the daily chart remains unconvincing. Traders operating on the hourly frame have clear bullish momentum to work with. Medium-term positioning, however, requires patience and evidence. Specifically, a sustained reclaim of the $128–$133 zone is needed before the daily trend can be called anything other than bearish. Volatility remains elevated, the ATR wide, and the fundamental valuation debate is far from settled. That combination demands measured conviction on both sides.
FAQ
Is Palantir stock bullish or bearish right now?
The daily chart remains structurally bearish with price below all three major EMAs. However, the hourly chart has turned bullish following the Nvidia catalyst, creating a short-term bullish window within a medium-term downtrend.
What are the key levels to watch for Palantir stock?
Support sits at the daily pivot of $124.44 and S1 at $120.64. Resistance is at R1 ($129.54) and the hourly EMA200 ($128.05). A reclaim of the $128–$133 zone is needed to challenge the bearish regime.
Did the Nvidia partnership change the technical outlook for PLTR?
The Nvidia catalyst triggered a sharp 9.3% bounce, but it has not yet repaired the daily chart’s bearish structure. A sustained move above key resistance levels is required before the trend can be considered reversed.
What is the daily ATR and volatility context for PLTR?
The daily ATR stands at $6.39, with Bollinger Bands spanning from $106.91 to $146.32. This wide range confirms high volatility, making $5–8 intraday swings normal for the stock.
Disclaimer: This article is for informational purposes only and does not constitute financial advice, an investment recommendation, or a solicitation to buy or sell any financial instrument or cryptocurrency. The analysis provided is not indicative of future results. Investing in crypto assets and financial markets carries a high risk of capital loss. Always do your own research (DYOR) and consult a qualified financial advisor before making any decision.
Article produced with the assistance of artificial intelligence and reviewed by the editorial team.