
The market gave an impulse, and everyone wants clarity.
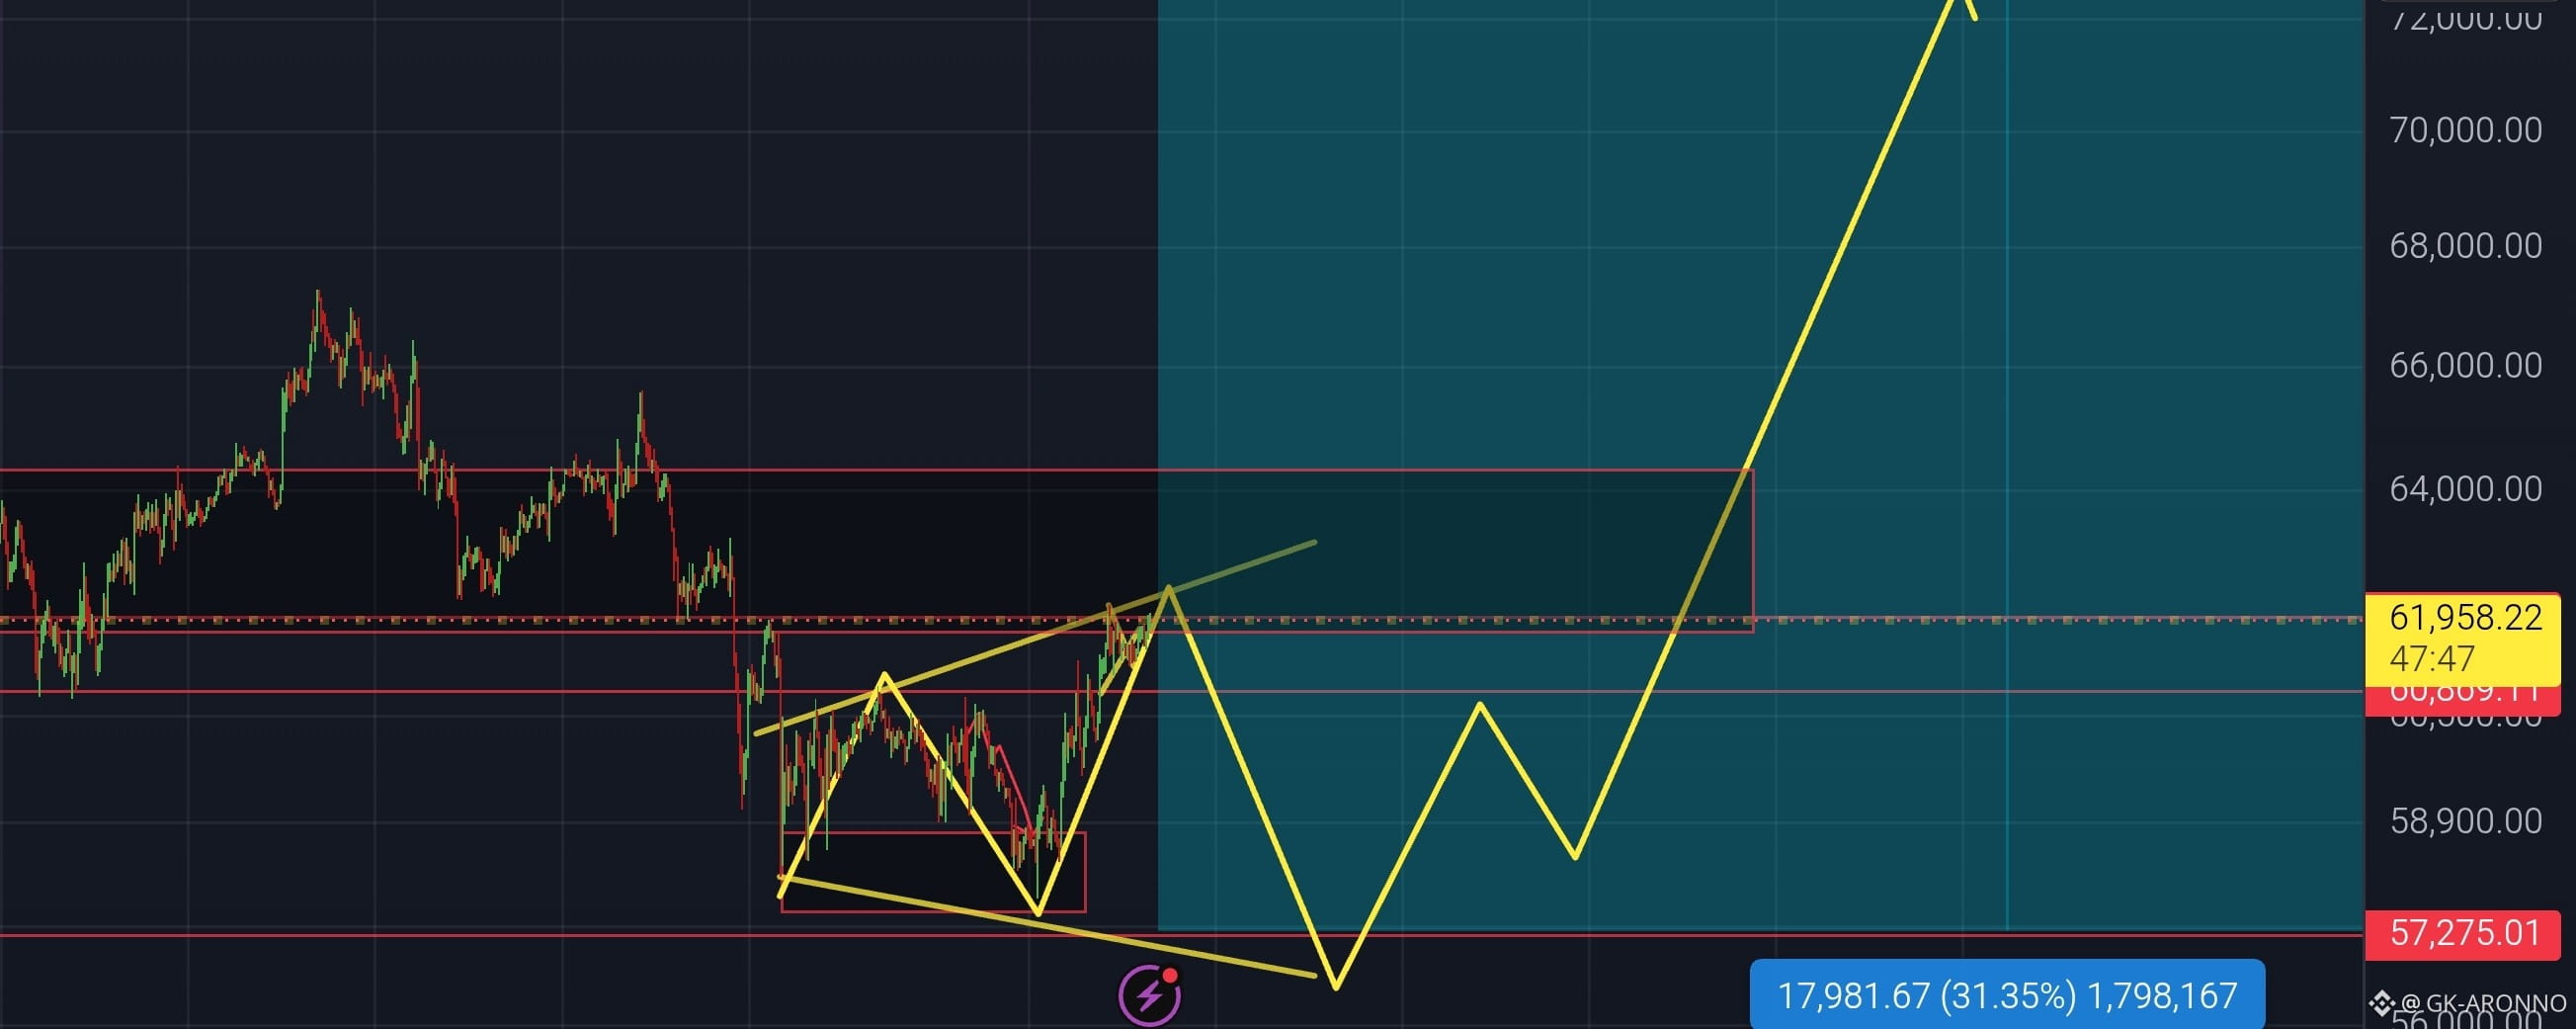
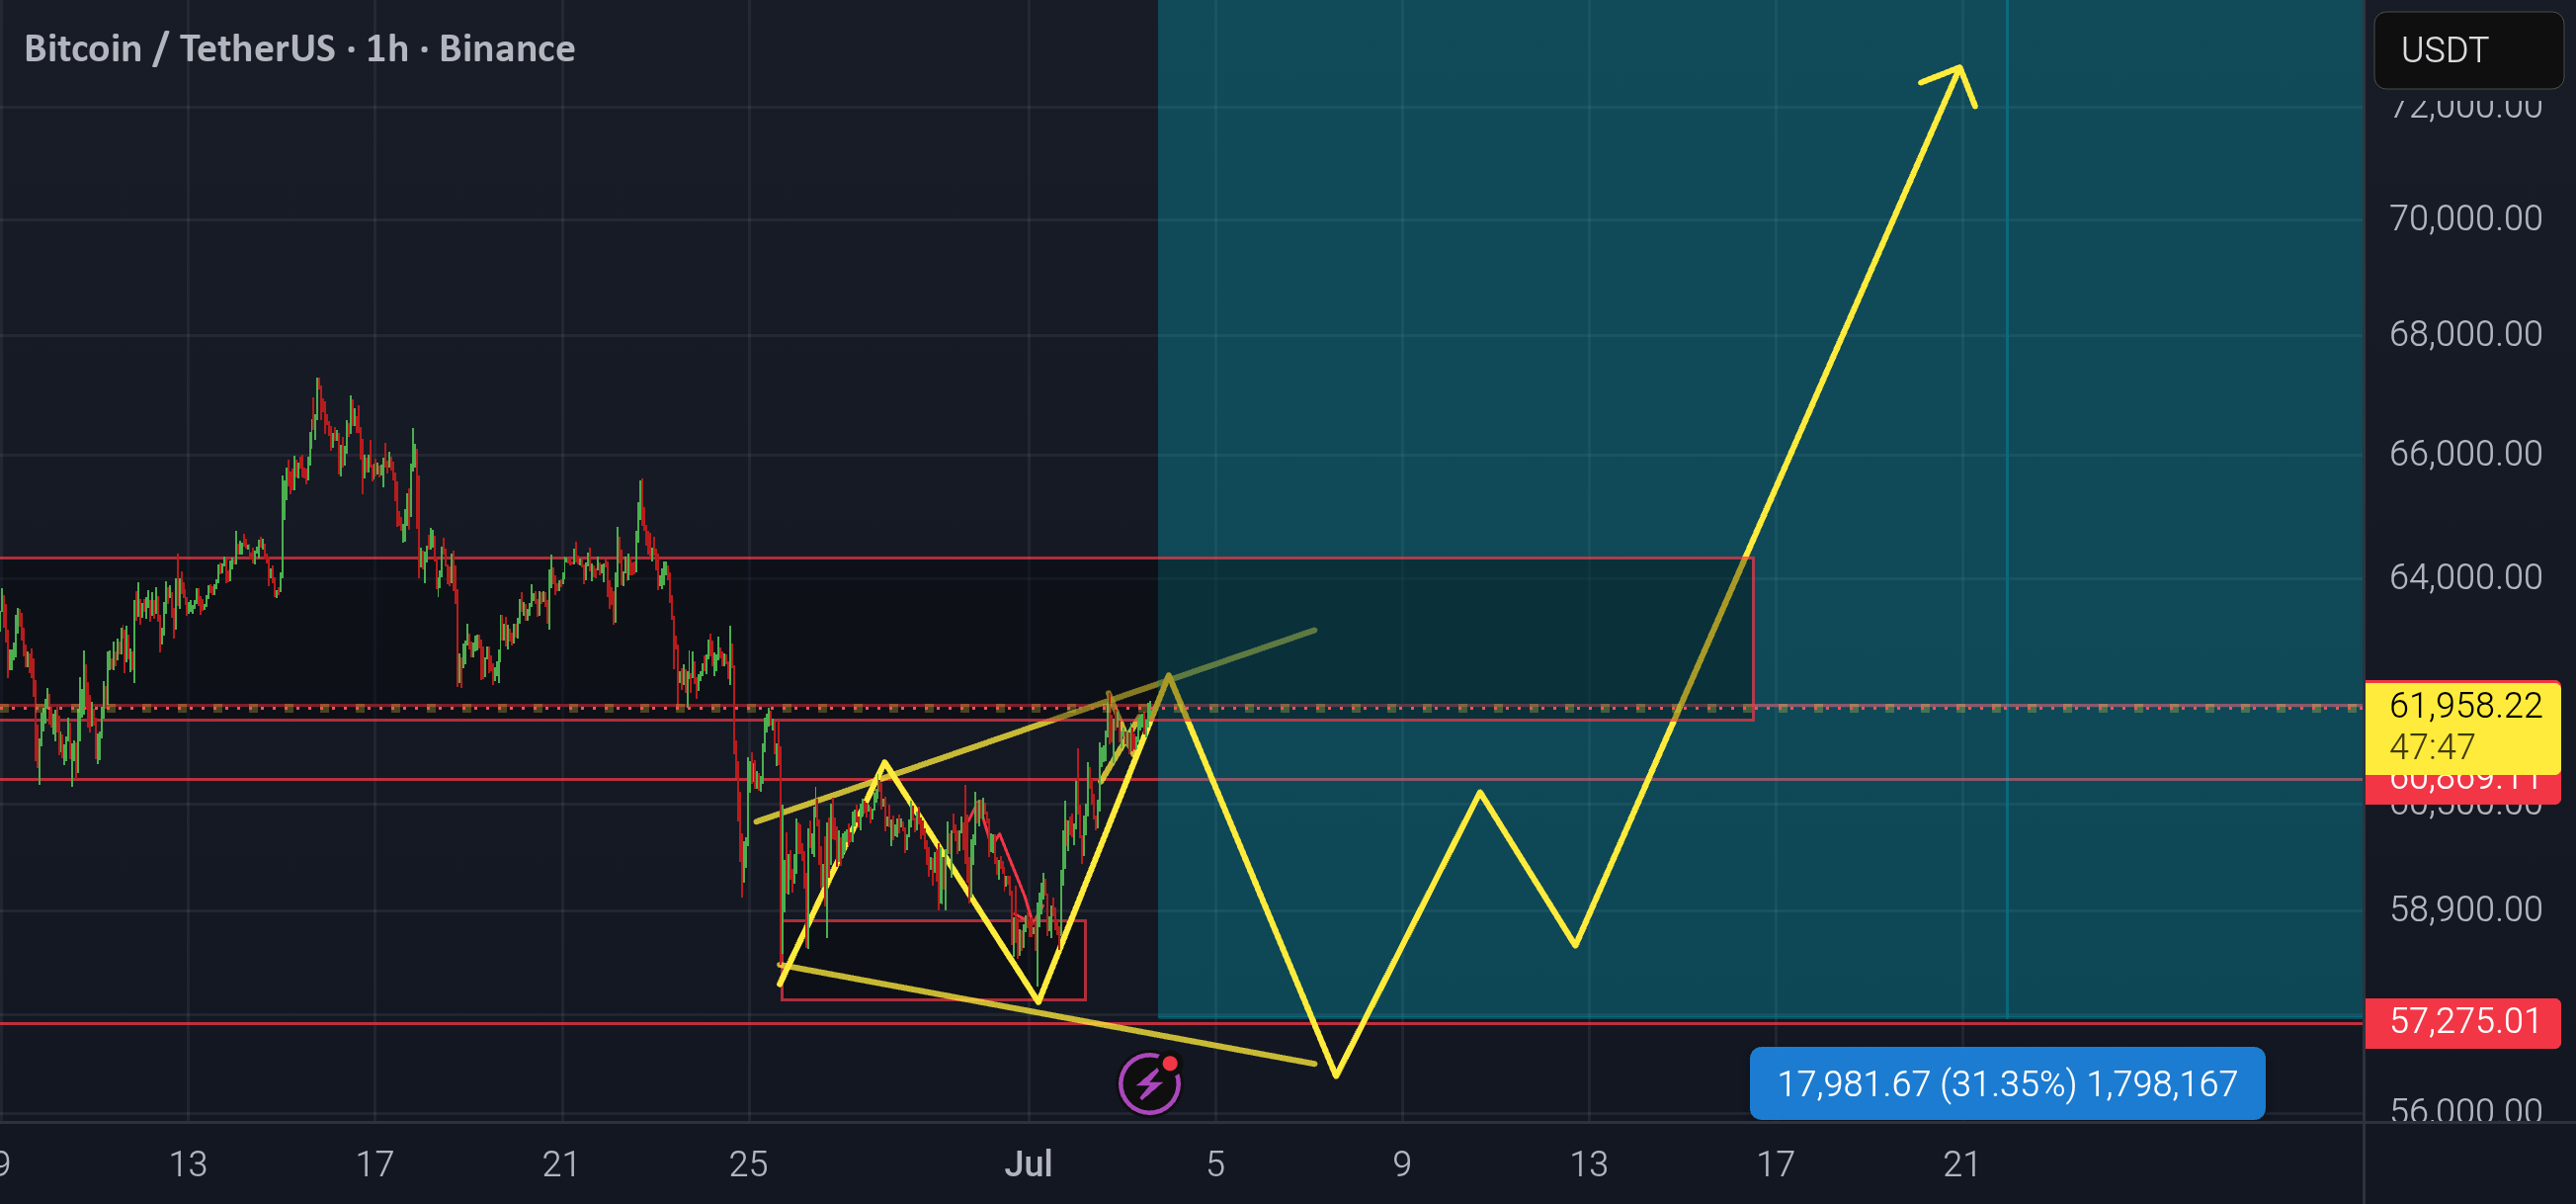
We are drawing a good pattern, in which a potential bottom is now visible, from which we can push off, as well as define targets.
Everything in order.
The hourly timeframe formed a diverging triangle.
👀 A liquidity block is visible at $58,600. Taking this into account, a large number of traders bought at these values and continue to add to positions from current levels. However, on the 4-hour timeframe a shelf is already visible at $74,200 — a fat cluster with three FVGs, which the market needs to take.
‼️ Based on clearly expressed indicative data, the $58–62K range is currently the maximum psychological zone, where a sideways movement is forming before the breakout.
At the moment the resistance is the $62,400 level, and support has shifted to $56,800.
⚠️ What is important to consider right now: the price may overcome resistance from current levels as well, however it would be desirable to see a complete fill of the pattern with a subsequent buyback and exit above the sloping line.
✔️ Retest of $58,600 with a subsequent update of the LOW, crash, capitulation of the majority of positively minded market participants and complete belief in a move toward $40,000, after which a reversal of 35–40% of pure movement.
Why exactly 35–40%❓ Almost every strong move downward in previous years was accompanied by growth in July, which I expect to see in 2026 as well.
LONG vs SHORT
As for August, it is not excluded that it will return the bearish trend and show us the true BOTTOM.
I will stick to this strategy.
