
XLMUSDT
Бесср
0.20135
-3.47%
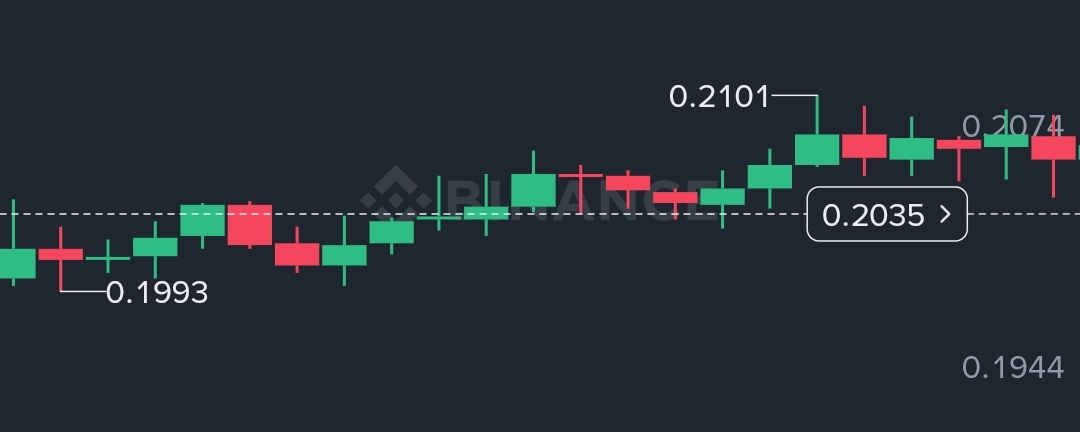
On the 1-hour chart, XLM/USDT has pulled back after failing to hold above the 0.2101 intraday high. The latest bearish candle shows increased selling pressure, but price is still trading within a broader recovery structure.
Support Zone: 0.2025 – 0.2035
Resistance Zone: 0.2075 – 0.2105
If buyers defend the 0.2030 area, XLM could rebound toward 0.2080 and retest the 0.2100 resistance. A decisive breakout above 0.2101 may open the path toward 0.2140 – 0.2180.
However, if 0.2025 fails to hold, the next downside target is around 0.2000 – 0.1990 before stronger buying interest may return.
Overall Bias: 🟡 Neutral to Bullish – The trend can recover if 0.2030 support holds, while a breakout above 0.2101 would confirm renewed bullish momentum.