One line that continues to shape markets
Even in 2026, when markets are faster, deeper, and more algorithm-driven than ever before, one technical tool continues to influence the behavior of traders, institutions, and bots alike: the 200-day moving average. While Bitcoin’s ecosystem has evolved tremendously driven by ETF flows, institutional rebalancing, perpetual futures, and ultra-fast algorithmic execution the 200-day moving average remains a “line in the sand.” Not because it predicts the future, but because it provides a shared reference point, a kind of market compass that allows participants to answer a single critical question: Are we in a healthy trend or not?
What Is the 200-Day Moving Average?
The 200-day moving average (DMA) is simply the average closing price of Bitcoin over the past 200 days. Traders often use either the simple moving average (SMA) or the exponential moving average (EMA) version. The EMA reacts slightly faster to price changes, while the SMA smooths out fluctuations more evenly. Despite the minor differences, both serve the same core purpose: providing long-term trend context.
Think of it as a “market thermometer”:
Price above the 200 line → market is warm (bullish bias)
Price below the 200 line → market is cold (bearish bias)
Price hovering around the 200 line → market is undecided (sideways/transition)
It is this simple yet powerful context that separates informed decisions from emotional reactions, particularly in volatile markets like Bitcoin.
Why Traders Often Fall into Traps
One of the biggest challenges in trading Bitcoin is the natural human tendency to react to the last candle or the most recent price movement. This behavior leads to two common pitfalls:
1. Panic selling during normal pullbacks when the price dips, many traders assume the trend is over.
2. FOMO buying after late pumps when the price spikes, traders often rush in too late, paying high prices and risking immediate losses.
In 2026, these mistakes are amplified. Bitcoin’s liquidity is deeper, derivative markets are massive, and bots execute trades in microseconds. Emotional trading in this environment can quickly turn profitable setups into frustrating losses.
The Core Idea: Ask One Simple Question
The 200-day moving average simplifies the chaos. Before taking any action, ask yourself:
“Where is BTC relative to the 200-day line?”
This single question provides context, helping traders avoid knee-jerk reactions and giving clarity about the market phase before executing trades.
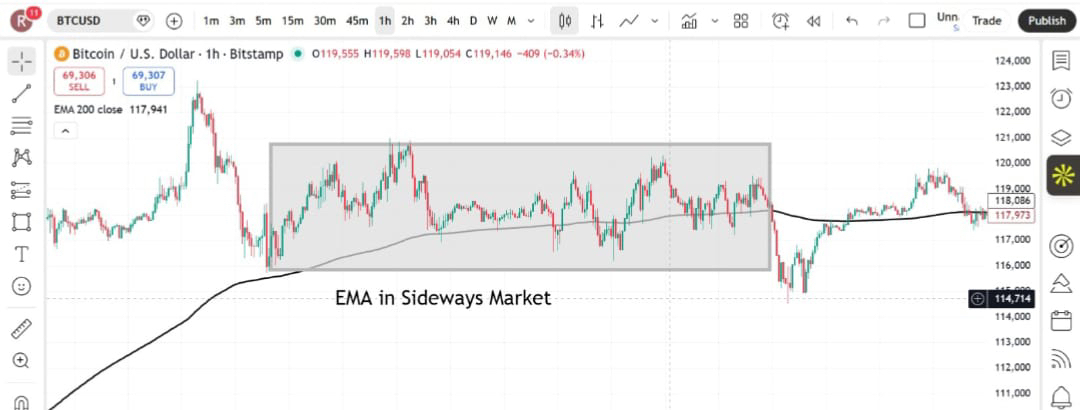
Sideways Markets: The EMA as a Magnet
In a sideways or range-bound market, the 200-day moving average often behaves differently. Price may repeatedly cross above and below the line, creating confusion and false signals.
Price moves within a box/range
EMA 200 often lies near the center of this range
Price repeatedly crosses it
What This Means
In sideways markets, the 200 line is not a clean support or resistance. Instead, it acts as a magnet, attracting price movements and creating false signals.
Why Traders Lose Here
Buying when price crosses above → price drops again
Selling when price crosses below → price pumps again
This pattern is known as “getting chopped,” where frequent whipsaws eat into profits and punish emotion-driven traders.
Practical Lessons
When BTC repeatedly crosses the 200 line:
Don’t treat it as a trend signal
Reduce trading frequency
Wait for a clear break and hold before committing
Avoid over-leveraging within the range
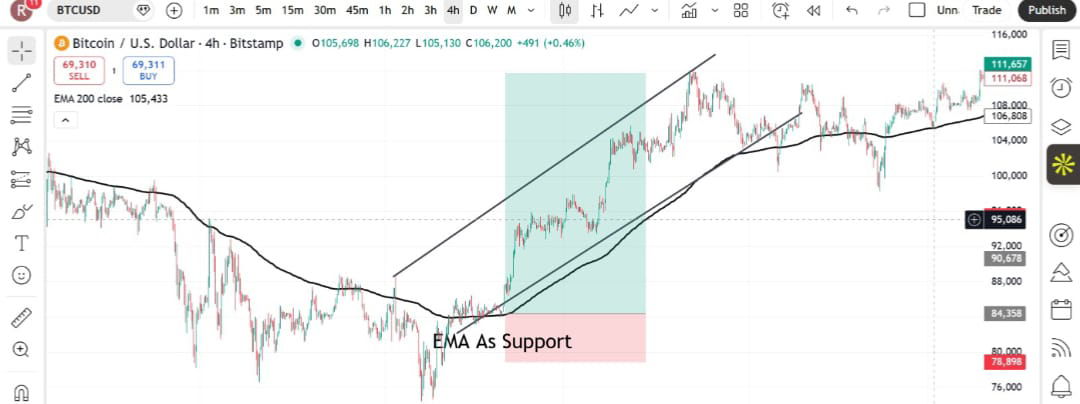
When the EMA Becomes Support
During an uptrend, the behavior of the 200-day moving average changes: it often acts as support.
Price moves from below to above the EMA 200
BTC trends upward
Pullbacks occur, but the EMA serves as a floor
Why This Matters
When price remains above the 200 line for an extended period:
Buyers feel confident
Dip-buyers step in early
Long-term holders resist panic-selling
The line becomes a shared reference point not because of magic, but because a critical mass of participants recognizes it as significant.
How to Use This
A drop toward the 200 line can be a normal pullback
A bounce from it shows trend health
A clean break below it, failing to reclaim, signals weakness
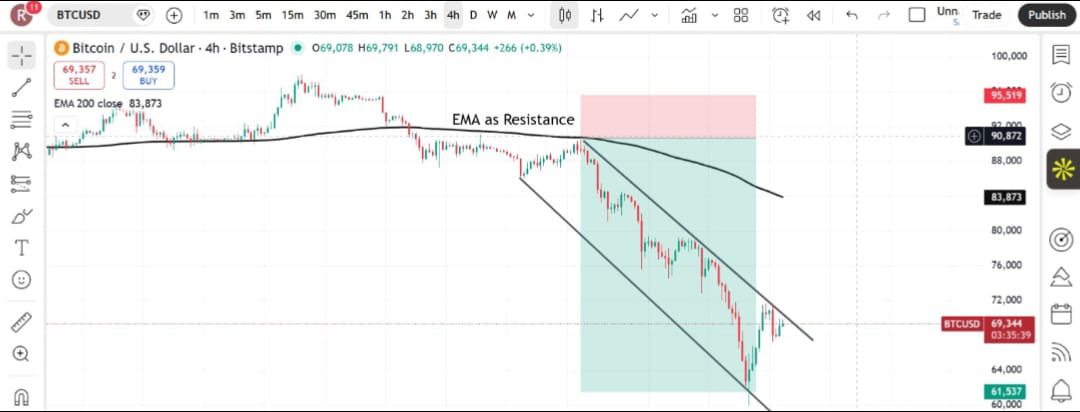
When the EMA Becomes Resistance
The character of the 200-day moving average flips once Bitcoin trades below it for a sustained period.
Instead of acting like a floor, it becomes a ceiling, resisting price gains. On the chart, you will notice:
1. Price trades below the EMA for an extended time
2. Rallies push toward the line but face selling pressure
3. Price fails to break above, reversing downward
Why This Happens
Three psychological forces drive this behavior:
1. Trapped buyers want to exit – traders who bought above the 200EMA during bullish markets are now in loss. As price approaches the EMA from below, they sell to break even, creating resistance.
2. New buyers hesitate – below the 200 line, investors are cautious. Dips are not bought aggressively, and rallies often fade.
3. Trend-following systems turn bearish – many bots use simple rules like “Above 200 → long; Below 200 → neutral/short.” These systems avoid buying toward the line from below, reinforcing resistance.
Trader Behavior
If BTC is below the EMA:
Don’t assume every rally is a new bull run
Treat price rallies toward the EMA as test zones
Wait for a clean reclaim and multiple-day hold above the EMA before turning bullish
In bull markets, the 200EMA is a floor; in bear markets, it becomes a ceiling.
Using the 200-Day Moving Average Effectively
Traders can simplify their decision-making using three questions:
1. Is BTC clearly above the 200 line?
Market bias: bullish
Buyers have control
Drops are often temporary pullbacks
How to act:
Don’t panic on dips
Prefer patience and structured entries
Avoid chasing tops; wait for pullbacks
2. Is BTC clearly below the 200 line?
Market bias: bearish
Confidence is weaker
Pumps are often traps
How to act:
Reduce position sizes
Avoid emotional FOMO
Wait for a reclaim and hold before aggressive entries
3. Is BTC hugging the 200 line and crossing it repeatedly?
Market is undecided
False signals are common
Transition phase between trends
How to act:
Trade less
Wait for confirmation (break + hold)
Let the market show direction first
Common Misconceptions
Myth 1: “Above 200 means it must go up.”
Truth: The 200 line is a context tool, not a prediction tool. Price can still drop.
Myth 2: “Every touch of the 200 line is a perfect buy.”
Truth: In sideways markets, touches can fail repeatedly.
Myth 3: “One candle below the line means bear market.”
Truth: What matters is whether price breaks and stays below, failing to reclaim.
Why the 200-Day Moving Average Still Matters in 2026
Even as markets become more complex:
Institutions use simple rules – ETF and large funds rely on trend-health signals
Bots follow regime filters – algorithmic trading uses the 200 line to classify environments
Human psychology anchors on familiar levels – the line becomes a shared reference
The more participants respect it, the more meaningful it becomes — creating a self-reinforcing coordination point.
Quick Checklist
✅ Above 200 line → bullish bias → don’t panic sell
✅ Below 200 line → cautious bias → don’t FOMO buy
✅ Crossing repeatedly → sideways → trade less, wait more
---
Final Thoughts
In 2026, Bitcoin’s ecosystem may be faster, deeper, and more algorithmically sophisticated, but the 200-day moving average retains its relevance. It isn’t a magical crystal ball; it is a shared framework — a simple yet profound tool that aligns traders, institutions, and bots. Its power lies not in prediction, but in providing context, allowing market participants to ask a single essential question before taking action:
“Where is BTC relative to the 200-day line?”
Answer this, and you navigate the chaos with structure rather than emotion.
