$BTC Price Analysis – Descending Channel Breakdown & Reversal Setup
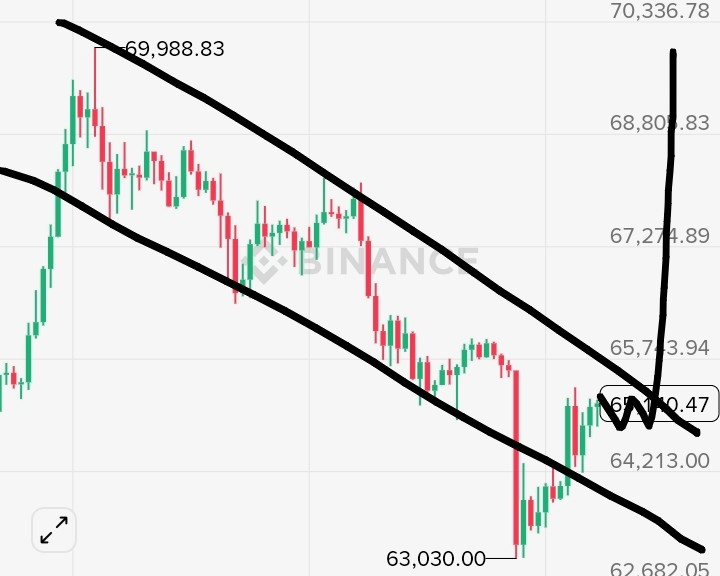
Bitcoin is currently trading inside a clear descending channel, forming consistent lower highs and lower lows from the 69,988 resistance zone. The chart shows strong bearish pressure as price respected the upper trendline multiple times before continuing downward.
Recently, $BTC dropped sharply to 63,030, where strong buying pressure appeared. This level acted as key support, leading to a relief bounce toward the mid-channel resistance around 65,700–66,000.
Now the critical zone to watch is the upper channel resistance near 66,800–67,200. A confirmed breakout above this trendline with strong volume could shift short-term momentum bullish, targeting:
• TP1: 67,800
• TP2: 68,800
• TP3: 70,300
However, if $BTC gets rejected again from the upper trendline, price may revisit:
• Support 1: 64,200
• Support 2: 63,000
Stop Loss (for long positions): Below 62,800
Currently, this is a potential trend reversal zone. Traders should wait for confirmation — either a breakout above the channel or a rejection signal for short continuation.
Market structure remains bearish inside the channel, but a breakout could trigger strong upside momentum.
Trade smart and manage risk properly.