🔍 General Evaluation:
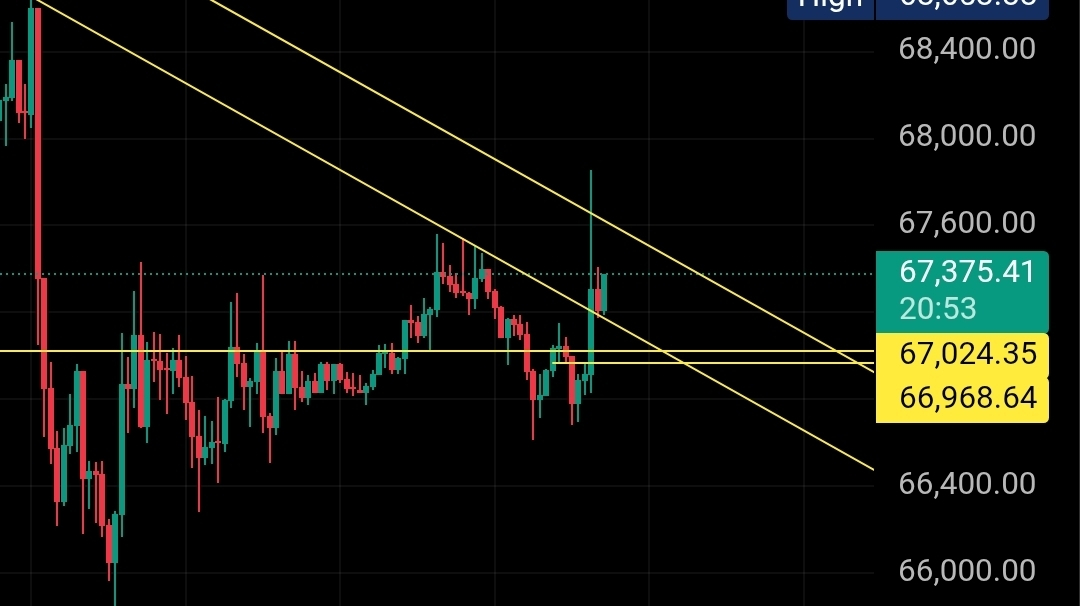
* Current Price: Approximately 67,343
* Trend: The overall trend is currently Bullish. All indicators support the upside: MACD, Stochastic, Fisher, and RSI are all flashing positive signals.
* Range: The recent peak is around 67,856, and the recent swing low is around 66,611. These are high-probability zones for market manipulation or liquidity grabs.
* Equilibrium: The balance level for the latest move is roughly 67,233, meaning the price is currently oscillating near the midpoint of the recent range.
📈 Key Levels to Watch:
* 67,562 📍 Immediate Resistance: Just above the current price; a breakout here could trigger rapid upward movement.
* 68,589 📍 Strong Resistance: A slightly higher level and a very clear Supply Zone.
* 69,487 📍 Major Resistance: A very strong resistance zone on higher timeframes.
* 67,150 📍 Immediate Support: Just below the price; if it holds, it provides a bullish push.
* 66,787 📍 Support: Breaking below this opens the door for further downside.
* 66,440 📍 Recent Swing Low: Falling below this level likely suggests a liquidity hunt or "stop run."
* 66,282 📍 Critical Support: A vital level to watch in case of a fast liquidity flush.
* 65,712 📍 Major Support: A distant level to watch if a deep correction occurs.
🚦 Liquidity Zones & Fair Value Gaps (FVG):
* There is a Bullish FVG between 67,180 – 67,350. If the price returns to fill this gap, we might see a bounce.
* The area between 67,562 and 67,850 is also a high-liquidity zone prone to heavy manipulation.
📌 Trade Idea (Trading Opportunity):
Long Scenario (Buy):
* Trigger: If the price breaks above 67,562 and closes an H1 (1-hour) candle above it. Look for confirmation (e.g., a Pin Bar, Bullish Engulfing, or a bounce from the same zone on lower timeframes).
* Entry: Enter on the retest of 67,562 or once buyer dominance is confirmed.
* Take Profit (TP): First target 68,580; if broken, the second target is 69,310.
* Stop Loss (SL): Preferably below the nearest clear swing low or under the 67,150/66,880 zone, depending on your risk appetite.
Short Scenario (Sell):
* Trigger: If the price breaks below 66,880 with an H1 candle close. Look for a rejection or Bearish Engulfing.
* Entry: Enter once the support breach is confirmed.
* Take Profit (TP): First target 66,611; if broken, targets are 66,282 down to 65,712.
* Stop Loss (SL): Above the recent peak or above 67,150.
🌟 Entry Confirmation Examples:
* Look for a clear Pin Bar or Bullish Engulfing candle upon breaking resistance. Alternatively, on lower timeframes (M15 or lower), look for a Change of Character (CHoCH) or reversal pattern at the level.
* High Volume during the breakout is a strong confirmation.
* Example: An H1 candle closing above 67,562 with strong volume—enter on the retest or the first minor pullback.
🌌 Personal Outlook:
* The general bias is Bullish on current timeframes. As long as the price stays above 67,150 and 66,880, I expect it to continue upward to test 67,562, and eventually 68,580.
* If manipulation occurs and we drop below 66,880, the price may head to clear liquidity around 66,611 or lower.
* Bottom line: Any clean breakout of resistance with confirmation is a Buy opportunity; any clean breakdown of support with confirmation is a Sell opportunity.