$BTC/USDT Market Analysis
Bitcoin ($BTC C) Short-Term Analysis
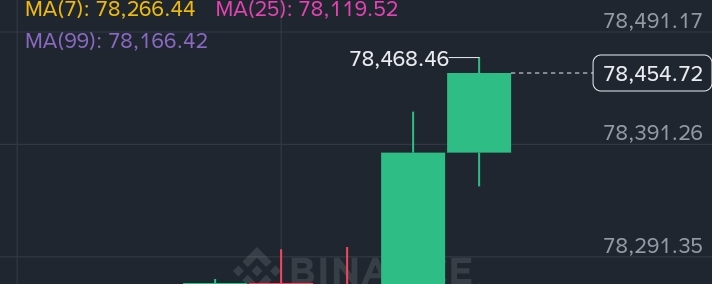
Bitcoin is currently trading around the 78,450$ zone on the 15-minute timeframe, showing strong short-term bullish momentum. The chart reflects a healthy recovery after bouncing from the 78,014 support area, where buyers stepped in aggressively.
The latest candles are forming higher highs and higher lows, which usually signals that bulls are gaining control of the market again. Price is also trading above the important moving averages:
MA(7): 78,266
MA(25): 78,119
MA(99): 78,166
This structure indicates that short-term momentum remains positive as long as BTC stays above the 78,200 support region.
One important thing visible in the chart is the strong green candle breakout after consolidation. This often shows increasing buyer confidence and possible continuation toward higher resistance zones.
Key Levels to Watch
Immediate Resistance: 78,600 – 78,800
Major Resistance: 79,000
Support Zone: 78,200
Strong Support: 78,000
If Bitcoin successfully breaks above the 78,600 resistance with volume confirmation, the market may attempt another push toward the 79k psychological level.
Volume activity also remains decent, which supports the current bullish structure. However, traders should still remain cautious because crypto markets are highly volatile and quick reversals can happen anytime.
Market Sentiment
Currently, short-term sentiment appears cautiously bullish. Buyers are defending dips, and momentum indicators suggest that $BTC still has room for another upside move if market conditions remain stable.
For scalpers and intraday traders, the current structure favors bullish continuation unless price loses the 78,200 sup$BTC