Educational Case Study for Aspiring Traders
Executive Summary
This educational analysis breaks down the daily market structure of the DEXE/USDT Perpetual pair using standard price action metrics, momentum oscillators, and trend-following indicators. The purpose of this study is to teach newcomers how to read high-volatility charts, calculate percentage-based target parameters, interpret candle shadows, and understand multi-indicator alignment without relying on guesswork.
The analysis explores two primary market paths between now and Monday, calculating exact percentage moves from the current benchmark price of 15.46 USDT.
1. Technical Indicator Breakdown
To understand where a cryptocurrency asset might move over a 24-hour window or an upcoming weekend, market technicians study several key layers: price location, momentum speed, and structural trend boundaries.
A. Trend Analysis via Parabolic SAR
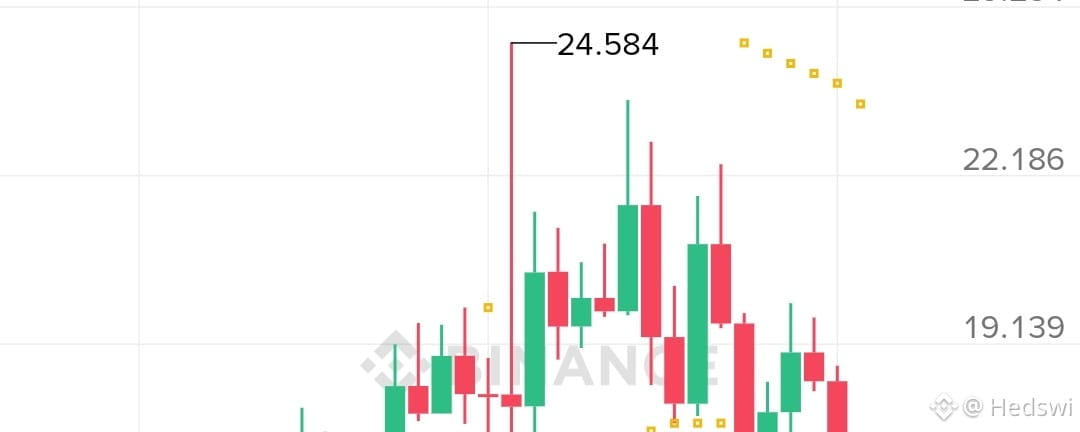
The Parabolic SAR (Stop and Reverse) is a foundational indicator used by systems traders to define the underlying directional bias. When the trailing dots are positioned above the daily price candles, the asset is mathematically locked in a structural markdown phase.
On this specific daily chart, the Parabolic SAR dots reside at 23.480 USDT. This significant distance between the current market price (15.46) and the trailing stop-loss boundary indicates that while smaller, short-term timeframes might show relief rallies, the dominant, large-scale structural trend remains heavily Bearish. For a true macro trend reversal to establish, the daily print must aggressively breach and close above this trailing threshold.
B. Momentum Analysis via RSI (6)
The Relative Strength Index (RSI) measures the velocity and magnitude of directional price movements. Standard settings use a 14-period window, but a highly sensitive 6-period setting reacts rapidly to extreme price fluctuations, highlighting immediate shifts in buying and selling pressure.
The current reading stands at 36.096.
The Oversold Threshold: Traditionally, an RSI reading below 30 demonstrates an overextended selling environment.
The Rebound Characteristic: While the indicator did not cross deep into sub-30 territory, its sharp upward curve from the local bottom shows an influx of aggressive short-term buyers stepping in to exploit depressed prices. This move creates a divergence between the falling price bars and a rising momentum line, supporting a temporary daily relief bounce.
C. Structural Candlestick Anatomy
The most telling data on the current daily chart is the structural formation of the immediate past candle. The asset witnessed an aggressive liquidation flush down to a local low of 13.045 USDT.
Instead of closing near the absolute bottom—which would indicate overwhelming, unchecked selling pressure—the candle closed significantly higher, leaving behind an extensive lower shadow (or wick). In professional trading, this specific anatomy signifies Institutional Liquidity Absorption. It demonstrates that when prices dropped over 15\%, a high volume of limit orders filled, validating 13.045 as an active, short-term support floor.
2. 24-Hour Market Mechanics & Volatility Data
Analyzing the 24-hour historical window provides a baseline for calculating standard daily volatility deviations.
3. Projected Technical Scenarios for Monday
When navigating volatile futures setups, mechanical traders never rely on singular, rigid predictions. Instead, they project distinct, rule-based mathematical pathways based on critical breakout and breakdown levels.
Scenario A: The Short-Term Relief Rally (Upward Trajectory)
If the immediate buying pressure witnessed over the last 24 hours sustains throughout the weekend, the asset will attempt to clear local horizontal distributions. This path is categorized as a counter-trend correction inside an ongoing bear market.
Target 1: Immediate Structural Resistance (16.092 USDT)
To test this local overhead barrier from the current base of 15.46, the price must climb an additional +4.09%. Passing this level confirms that buyers have successfully stabilized the short-term trend.
Target 2: Secondary Mid-Range Supply Zone (17.500 USDT)
If momentum breaks through the immediate resistance, the price has clean air to extend toward the mid-range target. This represents a cumulative upward move of +13.19% from current levels.
Target 3: Major Distribution Structural Ceiling (19.139 USDT)
In the event of an extensive short-squeeze across the broader altcoin market, the asset could attempt to test its major swing high on the daily timeframe. Reaching this zone requires an aggressive, multi-day expansion of +23.79%.
Scenario B: The Trend Continuation Phase (Downward Trajectory)
If trading volume dries up over the weekend or the broader market faces a sharp correction, the macro bearish trend highlighted by the Parabolic SAR will resume, invalidating the current short-term bounce.
Target 1: The Local Rejection Zone (14.200 USDT)
If buyers fail to breach the 16.092 level, sellers will re-enter the market, driving the price down by -8.15% to test intermediate daily order blocks.
Target 2: Immediate Local Support Floor (13.045 USDT)
A failure to hold the intermediate order block will force a complete retest of the recent liquidation low. Slipping from the current price back down to this foundational wick low represents a drop of -15.62%.
Target 3: Macro Liquidation Floor (9.998 USDT)
If the 13.045 support structures collapse entirely under intense liquidation pressure, the asset enters a macro price expansion to the downside, looking to tap historical liquidity reserves. This deep drop represents a structural decline of -35.33% from the current valuation.
4. Educational Guide: Key Principles for Newcomers
Entering the cryptocurrency futures arena requires a fundamental shift in mindset from gambling to calculated probability management. Below are the core operational rules every novice trader should memorize:
The Fallacy of "Up or Down"
Novice traders often ask whether a market is going strictly up or down. Professional risk managers look at charts as maps of probabilities rather than certainty. A professional trader establishes an "if-then" framework: If price breaks level X with high volume, then the probability favors a move to level Y. If the market does the opposite, the original bias is instantly abandoned.
Understanding Leverage Mechanics
Perpetual contracts allow traders to utilize leverage to amplify capital efficiency. However, leverage multiplies both gains and losses equally.
Trading at high leverage (e.g., 20x to 50x) means a tiny market move against your position by 2\% to 5\% results in a 100\% loss of your allocated collateral (liquidation).
Keeping leverage low (under 5x to 10x) gives positions structural breathing room to withstand volatile spikes and market sweeps.
The Role of Volume in Validating Moves
Price movement without volume is generally a trap. If a price moves up by +5\% on low trading volume, it implies that very few institutional participants are backing the move, making it highly susceptible to an immediate reversal. True breakouts require surging volume data to prove commitment from major market players.
5. Educational Risk Management Framework
To survive long-term in derivative markets, traders use strict mathematical rules to protect capital.
The 1% Capital Rule: Never risk more than 1\% of your total trading portfolio balance on any single trade. If your account holds 1,000, your maximum realized loss on a stopped-out position should never exceed 10.
Defining the Risk-to-Reward Ratio (R:R): Always ensure that the potential profit target is at least twice as large as the potential loss at the stop-loss level. A healthy minimum benchmark is an R:R of 1:2. This means that even if you lose 50\% of your trades, your winning positions will outpace your losses, keeping your net account growth positive.
Pre-Determined Invalidation Points: Before clicking the "Buy" or "Sell" buttons, a disciplined trader already knows exactly where their stop-loss will be placed based on structural chart levels. If a trade idea relies on the 13.045 support level holding, the automated stop-loss must be placed slightly below that level to prevent catastrophic financial damage if the support breaks.
6. Educational Disclaimer
IMPORTANT DISCLAIMER: This publication is created strictly for educational, informational, and academic study purposes. None of the contents, percentage calculations, indicator breakdowns, or structural scenarios outlined herein constitute financial, investment, legal, or professional trading advice. Cryptocurrency trading, asset speculation, and derivative leverage mechanics involve an exceptionally high degree of financial risk, market volatility, and the potential for total, irreversible capital loss. The metrics, data points, and technical interpretations shared represent an un-audited historical snapshot of market conditions and are subject to immediate alteration by real-time order-flow changes. The author does not guarantee the accuracy, completeness, or future validity of any mathematical models or directional pathways discussed. Every individual is entirely and solely responsible for their own financial decisions, capital allocation, and risk mitigation strategies. Do not risk capital that you cannot afford to lose completely. Always consult with a certified, independent financial advisor prior to participating in speculative financial markets.