Can ETH Hit $1,870? Understanding Liquidity Grabs and Multi-Timeframe Data
Introduction: The Current Market State
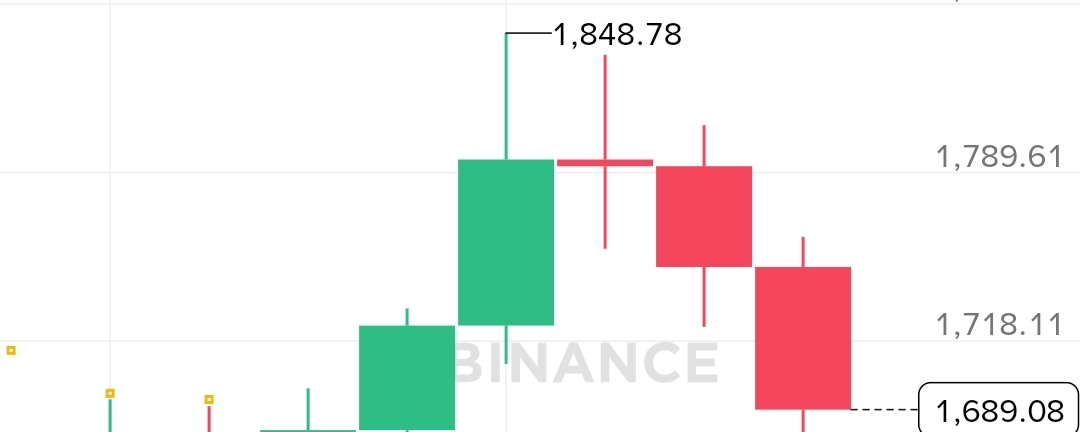
The cryptocurrency market is currently experiencing intense volatility. Following a sharp rejection from recent local highs near $1,789, Ethereum (ETHUSDT) has pulled back significantly, leaving many retail traders wondering about the next macro directional move. When analyzing whether a major level like $1,870 can be reached, professional traders do not guess; they look at market structure, order books, historical consolidation zones, and momentum indicators across multiple timeframes.
This educational piece breaks down the structural mechanics required for such a move, looks at the critical support and resistance lines, and evaluates the precise conditions under which an upside target like $1,870 becomes viable.
Section 1: The Road to $1,870 – Is It Possible?
To answer whether ETH can hit $1,870, we must analyze the market using the principles of liquidity and market volume.
1. The Mechanics of a Short Squeeze
In crypto futures trading, major psychological numbers (like $1,800, $1,850, and $1,870) act as heavy clusters for stop-losses and liquidation prices of short positions. When institutions or "Whales" want to push the market higher, they trigger what is known as a Short Squeeze. By aggressively buying at key support levels, they drive the price upward rapidly. As the price climbs, short sellers are forced to buy back their positions to close them or face liquidation, which acts as fuel to rocket the price even higher.
2. The Crucial Target Zone ($1,870)
Looking at historical daily charts, the $1,850 to $1,870 region represents a significant Order Block and a previous breakdown point. Whenever a market aggressively dumps from a specific level, it leaves behind an "imbalance" or "fair value gap." The market naturally wants to retest these gaps in the future to balance out the order book. Therefore, hitting $1,870 is entirely possible within a macro bullish structure or during a massive relief rally, but it cannot happen in a single straight line without solid foundation-building at lower levels.
Section 2: Comprehensive Multi-Timeframe Up/Down Data
To execute successful swing setups, a trader must align shorter-term charts with longer-term trends. Below is the technical data gathered from recent market behavior across key timeframes:
A. Shorter-Term Timeframes (15-Minute & 1-Hour Charts)
Downside Factors: Shorter timeframes recently showed a massive liquidation cascade where the market dropped heavily from the $1,770–$1,789 range down to the $1,670–$1,680 zones. High selling volume indicates that immediate momentum remains under bearish control. Any minor bounces are currently facing immediate selling pressure.
Upside Factors: The Relative Strength Index (RSI) on lower timeframes routinely dips into oversold territory (below 30), which historically triggers a short-term automated technical bounce. These minor bounces usually target immediate short-term Exponential Moving Averages (like the EMA 7 and EMA 25).
B. Medium-Term Timeframe (4-Hour Chart)
Downside Factors: On the 4-hour chart, the price broken down decisively below the vital EMA 99 (purple line), which was hovering near $1,760. When the price sits below the 4-hour EMA 99, the medium-term trend is technically categorized as bearish. Additionally, a massive contraction from an overbought RSI peak of 84–87 down to the 40s shows a significant shift in market power away from buyers.
Upside Factors: The 4-hour chart shows long lower "wicks" around previous swing lows, indicating that while sellers are aggressive, buyers are trying to step in to absorb the dump near key historical psychological baselines.
C. Macro-Term Timeframe (1-Day/Daily Chart)
Downside Factors: The Daily chart reveals a strong bearish engulfing structure. With consecutive large red daily candles breaking previous daily lows, the macro structure points toward a necessary cooling-off phase. The Parabolic SAR trend indicators or major long-term moving averages sit lower down near $1,572 to $1,620, acting as a strong gravitational pull for the price before any permanent reversal can be established.
Upside Factors: The Daily RSI is steadily heading down toward 39. It is not yet deeply oversold on a macro level, meaning the market is clearing out the froth and building a healthy foundation. Once the daily RSI bottoms out, the fuel for a massive trend reversal toward $1,870 will be generated.
Section 3: What Needs to Happen for ETH to Hit $1,870?
For Ethereum to reverse its current local downtrend and target $1,870, a very specific sequence of technical events must occur:
Step 1: Establishing a Rock-Solid Floor ($1,600 - $1,620): The market must first complete its current correction phase. It needs to test the major institutional demand zone between $1,600 and $1,620, absorb the remaining panic sellers, and form a clear bullish reversal pattern (such as a Double Bottom or a Bullish Morning Star candle).
Step 2: Reclaiming Medium-Term Resistances ($1,760): Once a floor is established, bulls must push the price back up and print sustained daily closes above the 4-hour EMA 99 ($1,760). Reclaiming this level flips the market psychology from "sell the rallies" to "buy the dips."
Step 3: Breaking the Local Liquidity Wall ($1,790 - $1,810): The final barrier before $1,870 is the recent high water mark of $1,790 to $1,810. A clean breakout above this zone, backed by high trading volume, will trigger massive short liquidations, driving the price directly into the $1,870 order block.
Section 4: The Golden Rules of Risk Management
While tracking a high target like $1,870 can be exciting, an educated trader always prioritizes risk over reward. If you plan to trade these volatility waves, your risk parameters must be strictly defined:
Avoid High Leverage: Trading with extreme leverage (such as 30x or higher) significantly shrinks your margin for error. A minor 3% counter-move can completely wipe out your position before the actual market direction plays out. Keep leverage conservative, preferably capped at a maximum of 15x or lower.
Keep Margin Sizes Small: Never allocate a massive portion of your total capital to a single trade or asset. Restricting your active position margin to 15% to 16% of your available futures wallet ensures that even if the market experiences an unexpected flash crash, your account longevity is fully preserved.
Always Trade with Isolated Margin: Cross-margin setups risk your entire wallet balance during severe market anomalies. By utilizing Isolated Margin, you strictly confine your maximum potential risk to the specific margin allocated to that individual trade.
The Power of Stop-Losses: Never let a trade run without a predefined exit plan. A stop-loss is not a sign of failure; it is the ultimate shield that preserves your capital so you can live to trade another day.
Conclusion: Patience Wins the Game
In conclusion, hitting $1,870 is an entirely logical technical target for Ethereum, but the market structure dictates that a deeper healthy correction to retest major macro supports ($1,600–$1,620) must likely occur first to flush out weak hands and over-leveraged long positions. Do not chase the market in panic, do not force early entries during heavy red candles, and wait for clear technical confirmations before deploying capital.
Disclaimer: This post is strictly for educational and informational purposes only. It does not constitute financial, investment, or trading advice. Cryptocurrency markets are highly volatile and carry a substantial risk of capital loss. Always perform your own due diligence (DYOR) and manage your risk strictly before entering any financial market.