Bitcoin has a habit of moving fast—and not always politely. One week the market feels calm, the next it’s a waterfall of red candles. That’s why traders and long-term holders alike keep asking the same ququestioni: is a Bitcoin crash incoming, and can we see it before it happens? While no indicator predicts price perfectly, on-chain data often reveals stress points that charts alone can miss.
Below are some of the most useful on-chain warning signs that can hint at growing downside risk.
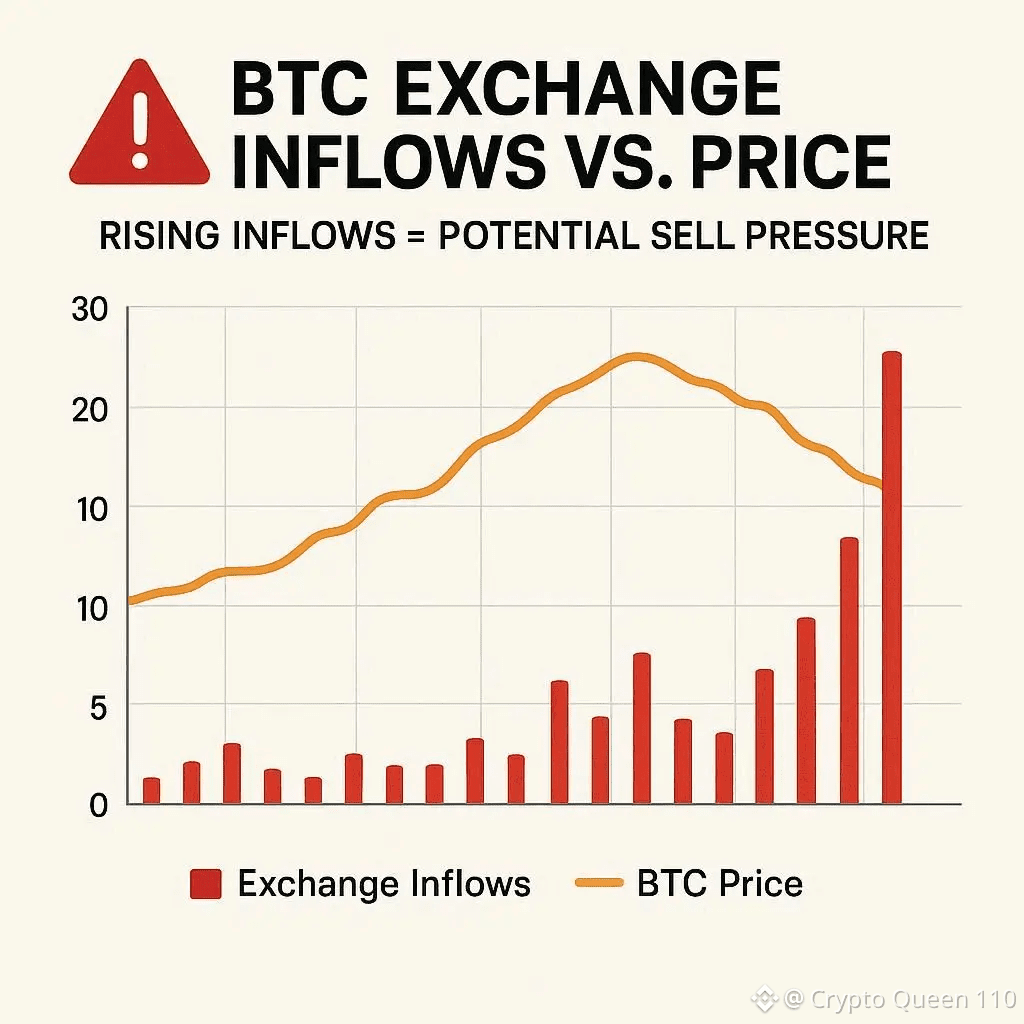
1) Exchange Inflows: Are Coins Moving Toward Sell Buttons?
One of the clearest red flags is a spike in **Bitcoin exchange inflows—when large amounts of BTC move from private wallets to exchanges. People typically send coins to exchanges to sell, hedge, or use as collateral. If inflows rise sharply over a short period, it can signal that selling pressure may be building.
What to watch:
- Sudden jumps in total BTC deposited to major exchanges
- Large single transactions (whales) hitting exchange wallets
- A rising trend over multiple days, not just a one-hour blip
2) Miner Behavior: Distribution vs. Holding
Miners are forced sellers to some extent—they need to cover electricity and operational costs. But when miners start sending more BTC to exchanges than usual, it can suggest they expect lower prices ahead or need liquidity urgently. Increased miner outflows sometimes appear during fragile market conditions.
What to watch:
- Higher miner-to-exchange transfers
- Declining miner reserves over time
- Miner profitability compression (often during downtrends)
3) SOPR and Spent Coin Signals: Are Holders Selling at a Loss?
The Spent Output Profit Ratio (SOPR) helps show whether coins are being sold at a profit or loss. When SOPR falls below 1 and stays there, it often means many holders are capitulating—selling coins for less than they paid. That behavior can fuel sharp drops, especially if panic spreads.
What to watch:
- SOPR consistently below 1
- A surge in “realized losses” (loss-taking spikes)
- Short-term holders capitulating more than long-term holders
4) Stablecoin Supply and Exchange Reserves: Is Buying Power Drying Up?
Stablecoins act like “dry powder.” When stablecoin reserves on exchanges rise, it can mean investors are gearing up to buy dips. When reserves fall or inflows slow, it may suggest demand is weakening—especially during uncertainty.
What to watch:
- Falling stablecoin exchange balances
- Lower stablecoin inflows during dips
- Reduced liquidity across major pairs
5) MVRV and Market Overheating
The MVRV ratio (Market Value to Realized Value) is often used to gauge whether Bitcoin is overheated. While it’s more helpful for spotting broader cycle tops than short-term crashes, an elevated MVRV can indicate the market is stretched and more vulnerable to sudden pullbacks.
What to watch:
- MVRV trending unusually high compared to historical norms
- Price rising faster than realized value growth
- Increased leverage in derivatives alongside high MVRV
Final Thoughts: On-Chain Data Helps, But Timing Is Hard
On-chain metrics don’t “call” the exact top. Instead, they work like smoke alarms—useful for spotting risk building under the surface. If multiple signals line up (heavy exchange inflows, miner distribution, SOPR weakness, and falling stablecoin reserves), it’s often a sign to manage exposure, tighten risk controls, and avoid emotional trades.
