ORDI surged 136.67%, 1000SATS gained 49.63%, and RAVE jumped 41.09%. All three saw massive volume spikes, but their drivers are completely different: ORDI and 1000SATS are riding a BRC‑20 ecosystem revival, while RAVE is a textbook supply shock driven by extreme low float and a violent short squeeze. Each is now testing critical resistance – chasing at these levels carries significant risk. 👀
📈 ORDI/USDT – 4H Chart Breakdown
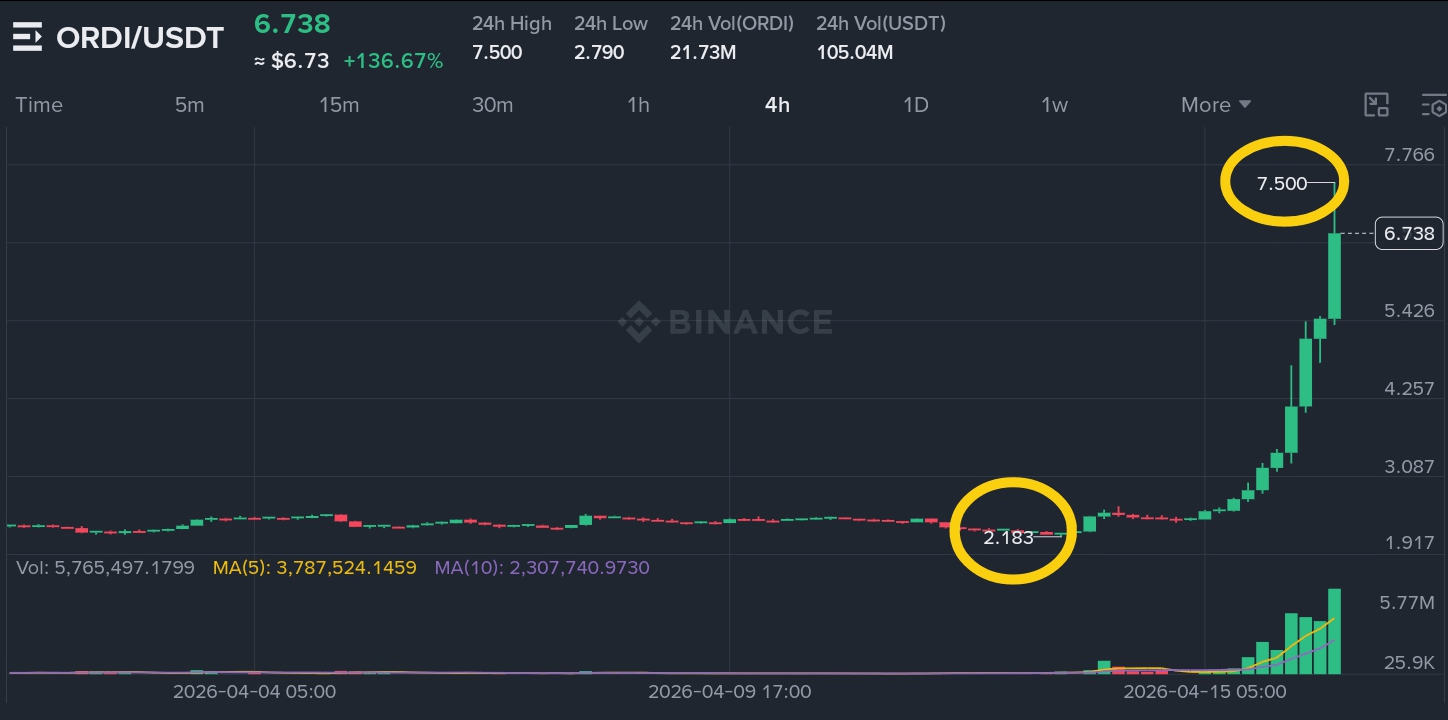
ORDI exploded from $2.79 (24h low) to $7.50, now pulling back to $6.738. Volume hit 21.73M ORDI ($105M USDT) – massive liquidity. The 4H chart shows a long upper wick, indicating sellers are active near $7.50. Support sits at $5.426 and $4.257. RSI has cooled from overbought 90 to 70 – still elevated but showing some consolidation. 📊
📉 Critical Levels
· Support: $5.426 🛡️ → $4.257 → $3.087
· Resistance: $7.500 🚧 → $8.000 → $9.000
· Alert: A close below $5.426 would signal a failed breakout.
🔍 Why This Move Happened
ORDI, the first BRC‑20 token, is positioned as the "Bitcoin ecosystem blue‑chip." The entire BRC‑20 sector saw a systemic rebound, with total sector market cap jumping 15% in 24 hours as markets re‑evaluate Bitcoin native assets. The rally was accompanied by genuine spot volume, not just manipulation. Derivatives data shows short sellers have been heavily punished – the long/short ratio is only 38.11%, meaning shorts are still heavily positioned and deep in the red, leaving room for further squeezes. Infrastructure upgrades (e.g., UniSat) are accelerating ecosystem adoption, and whale addresses have started accumulating.
📈 Bullish Path
Hold above $5.426 and reclaim $7.50 → next targets $8.00 and $9.00. Sustained volume is key.
📉 Bearish Threat
If $5.426 fails, expect a retest of $4.257 and then $3.087. Overbought RSI and whale‑short divergence could trigger a sharp pullback.
📊 Spot Entry Zones – 👉 $ORDI
🟢 Aggressive Long: Above $7.50 (close) → target $8.00–$9.00, SL $6.50
🛡️ Conservative Long: Wait for pullback to $4.25–$5.00 → target $7.50+, SL $3.80
🔴 Sell (Short): Below $5.00 (close) → target $4.25–$3.00, SL $6.00
🎯 Futures Zones (5‑10x leverage) ⭐
📈 Long: $6.00–$6.30 → target $7.20–$7.50, SL $5.50
📉 Short: $7.20–$7.50 → target $6.00–$5.50, SL $8.00
👉 Access this trade setup here 👇

📈 1000SATS/USDT – 4H Chart Breakdown
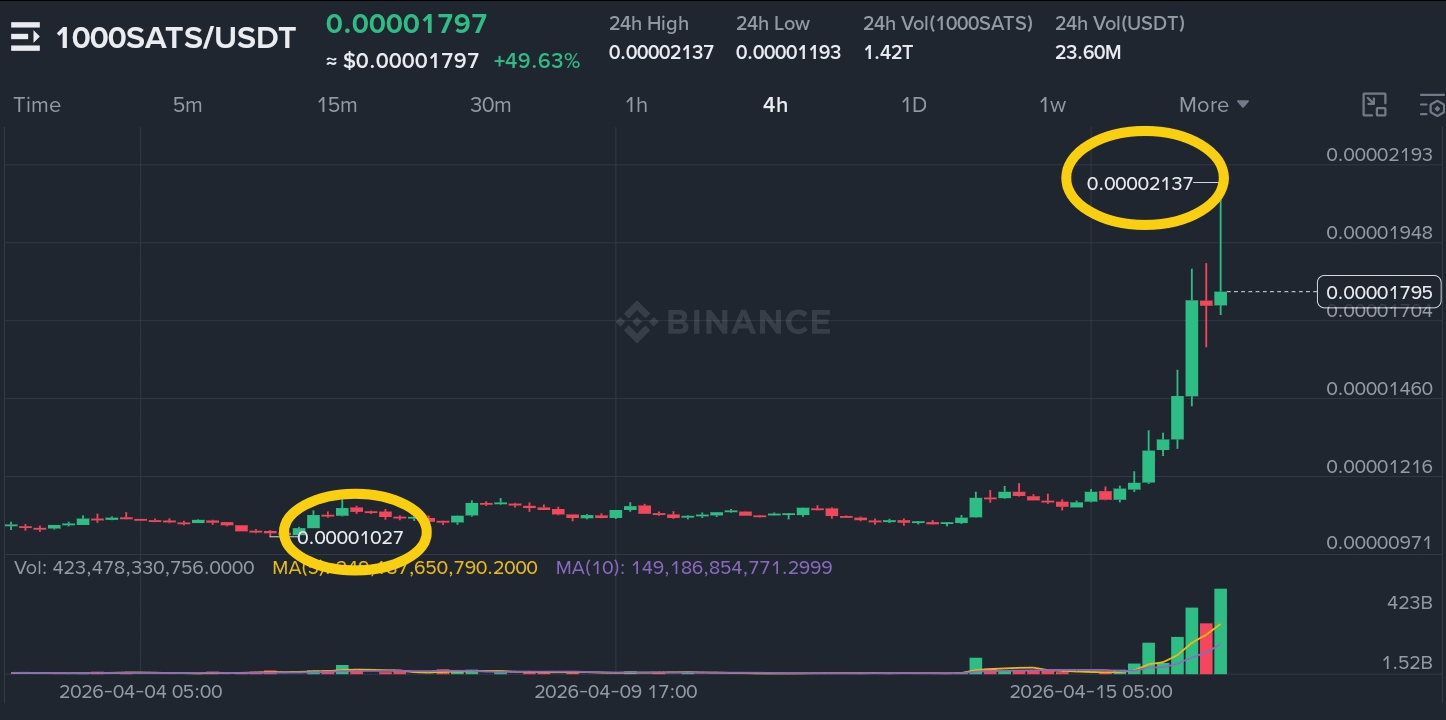
1000SATS rallied from $0.00001193 to $0.00002137, now trading at $0.00001797 – a 49.6% gain. Volume reached 1.42T tokens ($23.6M USDT). The 4H chart shows a sharp rejection wick at $0.00002137. RSI is at 85.7 – extremely overbought, with buy‑side depth imbalance of 30%, signaling overheating. Support sits at $0.00001795 and $0.00001460. Resistance is at $0.00002137 and $0.00002193.
📉 Critical Levels
· Support: $0.00001795 🛡️ → $0.00001460 → $0.00001216
· Resistance: $0.00002137 🚧 → $0.00002193 → $0.00002500
· Alert: A close below $0.00001795 would signal a sharp pullback.
🔍 Why This Move Happened
The move is purely technical: a short squeeze driven by overheated speculation. RSI hit 85.7, price broke above the upper Bollinger Band, and funding rates turned positive – all signs of extreme short‑term momentum. The rally is linked to the broader BRC‑20 narrative (alongside ORDI), but 1000SATS is more speculative and more vulnerable to a snapback. Analysts warn that chasing at current levels offers a poor risk‑reward ratio.
📈 Bullish Path
Hold above $0.00001795 and reclaim $0.00002137 → next targets $0.00002193–$0.00002500. Needs sustained volume and continued BRC‑20 momentum.
📉 Bearish Threat
If $0.00001795 fails, expect a retest of $0.00001460 and then $0.00001216. Overbought conditions suggest a pullback is highly probable.
📊 Spot Entry Zones – 👉 $1000SATS
🟢 Aggressive Long: Above $0.00002137 → target $0.00002193–$0.00002500, SL $0.00001850
🛡️ Conservative Long: Wait for a flush to $0.0000140–$0.0000150 → target $0.0000200+, SL $0.0000120
🔴 Sell (Short): Below $0.0000170 → target $0.0000146–$0.00001216, SL $0.0000195
🎯 Futures Zones (5‑10x leverage) ⭐
📈 Long: $0.0000175–$0.0000180 → target $0.0000205–$0.0000215, SL $0.0000165
📉 Short: $0.0000205–$0.0000210 → target $0.0000175–$0.0000160, SL $0.0000225
👉 Access this trade setup here 👇

📈 RAVE/USDT – 4H Chart Breakdown
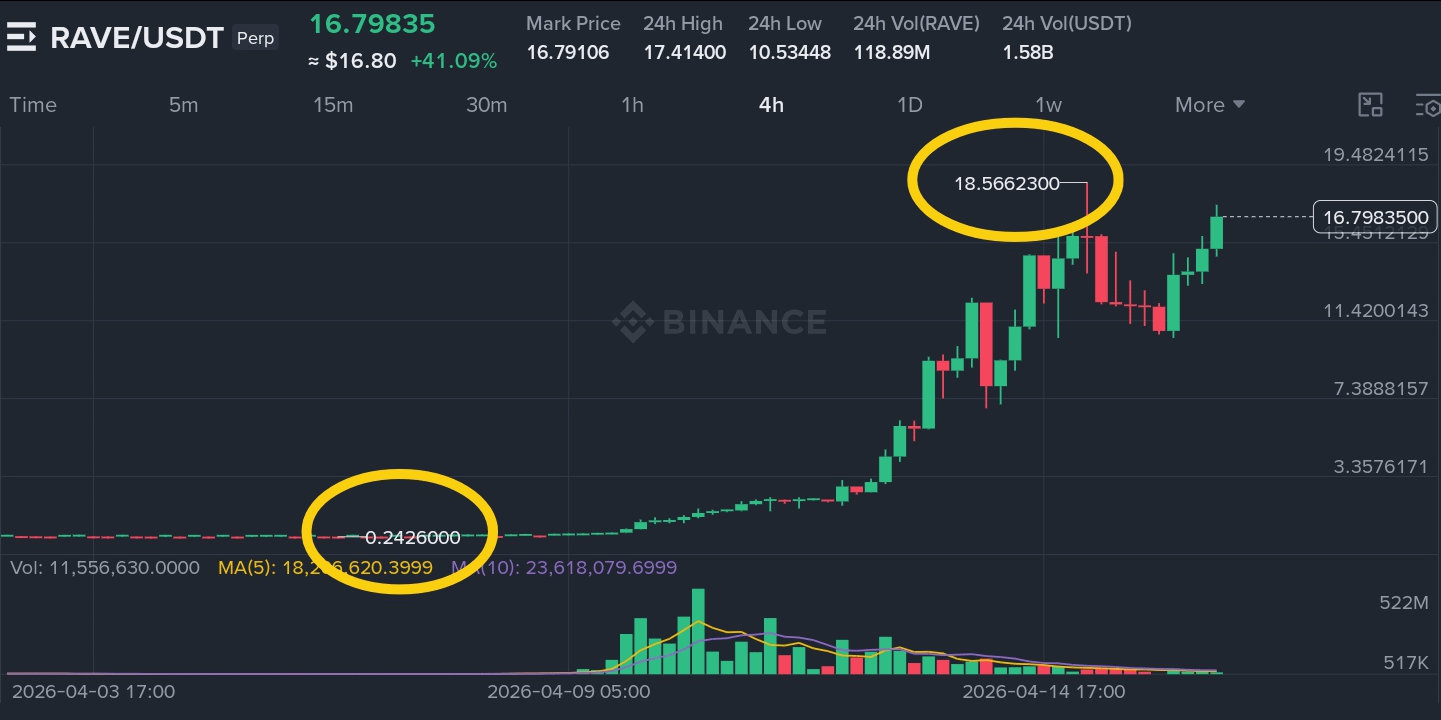
RAVE surged from $10.53 to $17.41, now trading at $16.80 – a 41% gain in 24 hours. Volume hit 118.89M RAVE ($1.58B USDT) – enormous for this asset. The 4H chart shows a parabolic spike, with price stalling just below $17.41. RSI is deep in overbought territory above 90 – extreme euphoria. Support sits at $16.80 and $11.42. Resistance is at $17.41 and $18.57. The derivative market for RAVE briefly saw the highest liquidation volume across all coins, surpassing even BTC and ETH. 🚨
📉 Critical Levels
· Support: $16.80 🛡️ → $11.42 → $7.39
· Resistance: $17.41 🚧 → $18.57 → $19.48
· Alert: A close below $16.80 would signal a potential reversal.
🔍 Why This Move Happened
RAVE is a textbook supply‑shock short squeeze. Only 24.8% of total supply is circulating, and the top 10 wallets hold 98% of tokens – extreme concentration. The RaveDAO team deposited tokens to exchanges at sub‑$0.50 levels, then used capital to pump price, triggering a massive short squeeze. In 7 days, RAVE went from $0.50 to $17 – a 4,500% rally, pushing its market cap from $60M to $2.8B. The team has not responded to manipulation accusations. The fully diluted valuation (FDV) is $16B, far above the $4B market cap, implying massive future unlock pressure. This is a high‑risk, team‑controlled token – chasing here is gambling.
📈 Bullish Path
Hold above $16.80 and reclaim $17.41 → next targets $18.57–$19.48. Extremely low probability – entirely dependent on team manipulation.
📉 Bearish Threat
If $16.80 fails, expect a retest of $11.42 and then $7.39. The FDV overhang and concentrated supply make a violent crash likely.
📊 Spot Entry Zones – 👉 $RAVE
🟢 Aggressive Long (Extreme Risk): Above $17.41 → target $18.57–$19.48, SL $15.50
🛡️ Conservative: Avoid entirely – extreme manipulation risk
🔴 Sell (Short): Below $16.00 (close) → target $11.42–$7.39, SL $18.00
🎯 Futures Zones (5‑10x leverage) ⭐
📈 Long: $16.00–$16.50 → target $17.50–$18.50, SL $15.00 (extremely high risk)
📉 Short: $17.00–$17.50 → target $15.00–$13.00, SL $18.50
👉 Access this trade setup here 👇

🧠 Key Takeaway (All 3 Coins)
· ORDI: Bullish above $5.426. Main resistance $7.50. BRC‑20 revival has legs, but overbought RSI suggests a pullback is likely first.
· 1000SATS: Extremely overbought (RSI 85.7). Main support $0.00001795. Chasing here is risky – a pullback to $0.0000146 is probable.
· RAVE: Extreme manipulation risk. Only 24.8% circulating, 98% held by top 10 wallets. Avoid trading this asset.
Let the 4H candle close confirm the breakout. ⏳
⚠️ Risk Management
· Not financial advice. Educational only. 📚
· Risk per trade: 0.5–1% of capital.
· Stop‑loss is MANDATORY! 🛡️
👇 Long or Short? Which setup looks best: ORDI, 1000SATS, or RAVE? Comment below! 💬
Like & Follow for daily trade setups! 🔔